Lucas County Tornadoes
4/11/1965 (F4) west Toledo to northeast Toledo
4/8/1980 (F2) east Toledo - Oregon
4/17/1981 (F0) Toledo-Rossford
7/12/1992 (F2) Whitehouse area, Anthony Wayne HS
5/9/2000 (F1) Sylvania
6/15/2023 Northeast Toledo (EF2) Oregon(EF0)
Wood County Tornadoes
6/8/1953 (F4) southern Wood County to near Cleveland
8/5/1961 (F0) southeast of Bowling Green
6/24/1968 (F0) north of Bowling Green
5/18/1969 (F0) near Grand Rapids
5/16/1971 (F2) Perrysburg
10/8/1977 (F0) southern Wood County (north of Findlay)
1/11/1980 (F0) Perrysburg
4/3/1980 (F1) Perrysburg
4/8/1980 (F2) southeast of Pemberville
4/17/1981 (F0) Toledo-Rossford
5/2/1983 (F3) Weston - west of Bowling Green
7/12/1992 (F2) Whitehouse area, Anthony Wayne HS-south of Perrysburg
7/12/1992 (F2) Perrysburg
6/4/1996 (F0) Custar
5/9/2000 (F0) Pemberville
5/9/2000 (F0) Hoytville
6/14/2000 (F1) Pemberville
11/10/2002 (F1) Jerry City (south of Bowling Green)
11/10/2002 (F0) Stony Ridge
11/10/2002 (F1) Millbury
8/24/2016 (EF0) Pemberville
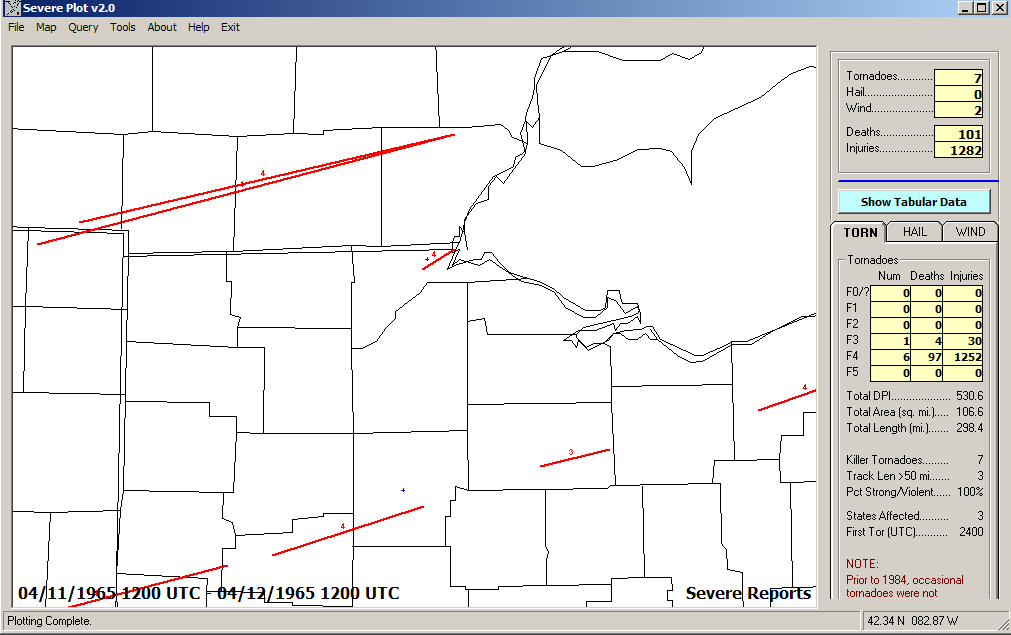
April 11, 1965
Storm reports (local)
Tornado reports (large view)
500mb plot (morning)
500mb plot (evening)
500mb contour (mid-day)
Sounding from Dayton OH (DAY) 1 or 2 hours before the Toledo tornado occurred. The data is incomplete, but you can guess that the CAPE could be in the 1000 J/kg range, and the 0-6km shear and helicity (SRH) are excellent and probably the same was true near Toledo.
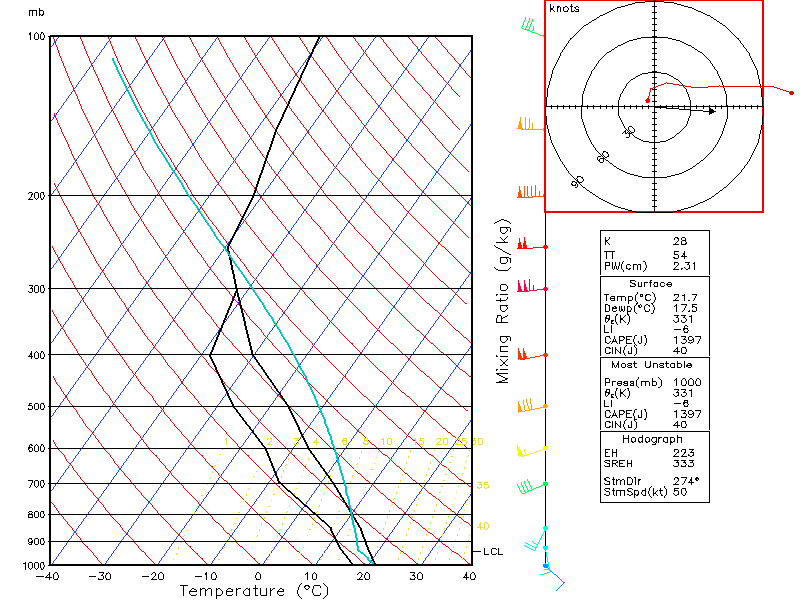
The CAPE on the Toledo Skew-T (reanalysis) was 1300J/kg and the helicity was around 330 m2/s2, with 0-6km shear of around 80 knots.
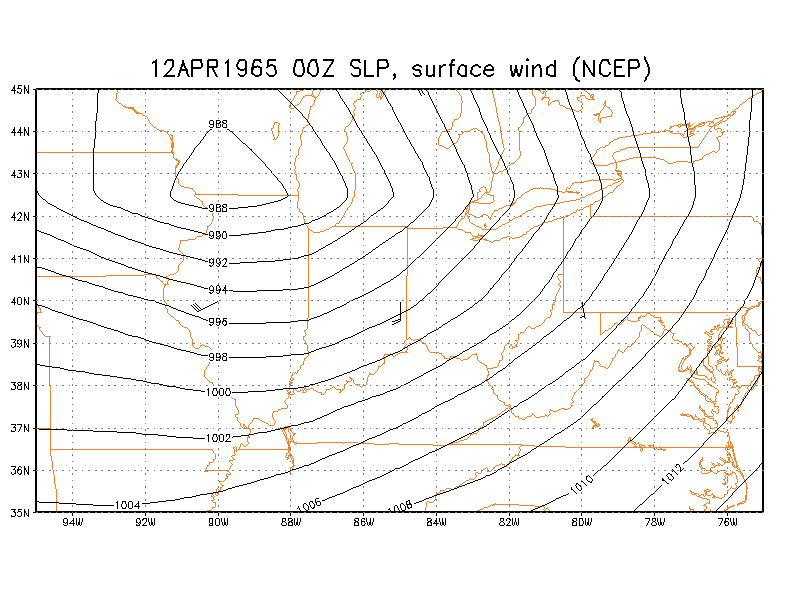
00z Surface wind and SLP (NCEP)
Skew-T for Toledo at 00z (NCEP)
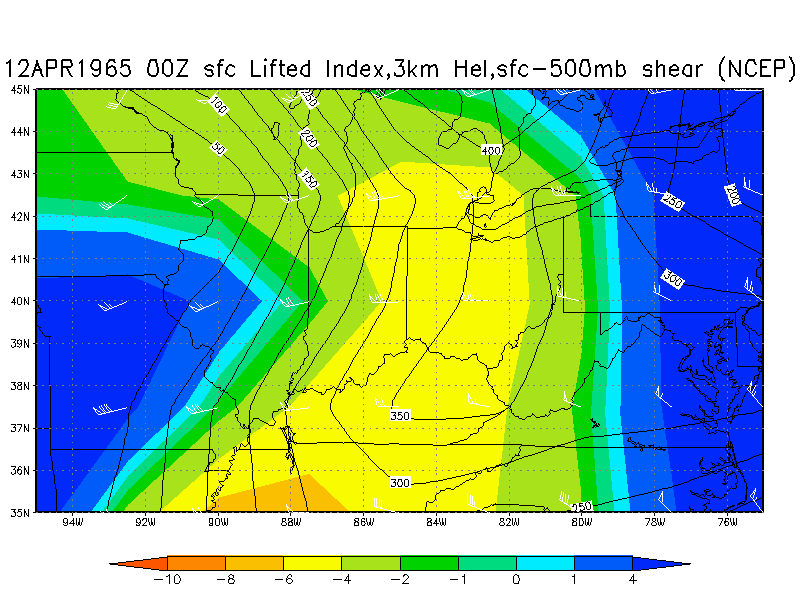
00z Lifted Index/3km Helicity/surface-500mb wind shear composite (NCEP)
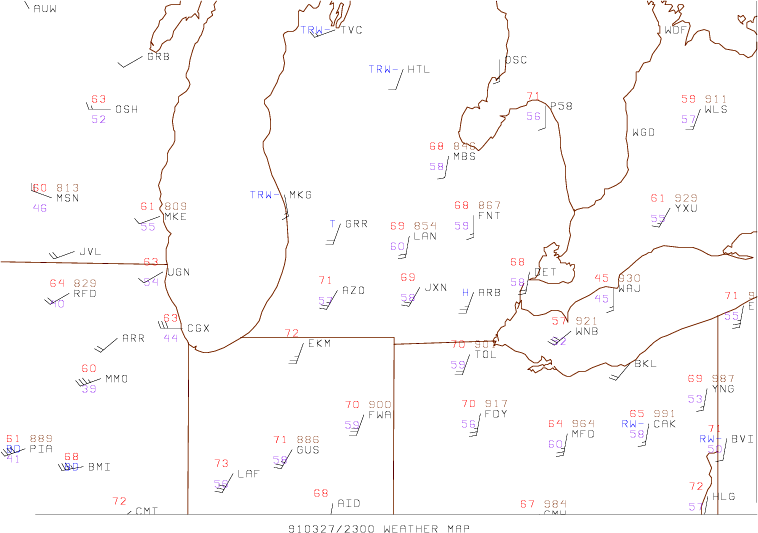
March 27, 1991
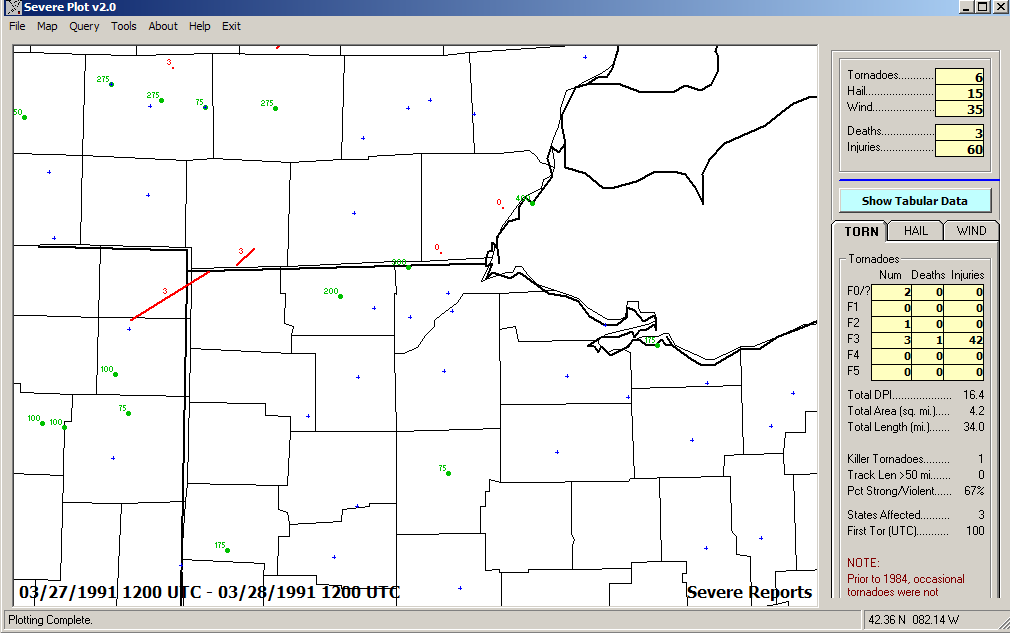
Storm Reports
Storm Reports (wide view)
A tornado at Nettle Lake, near the border with Indiana and Michigan, actually mostly in Indiana. It started at 0119Z and the one in Hillsdale county started at 0137Z. (8:19PM EST and 8:37PM EST). The F0 tornado just north of Toledo in Lenawee county was at 0238Z or 9:38PM EST.
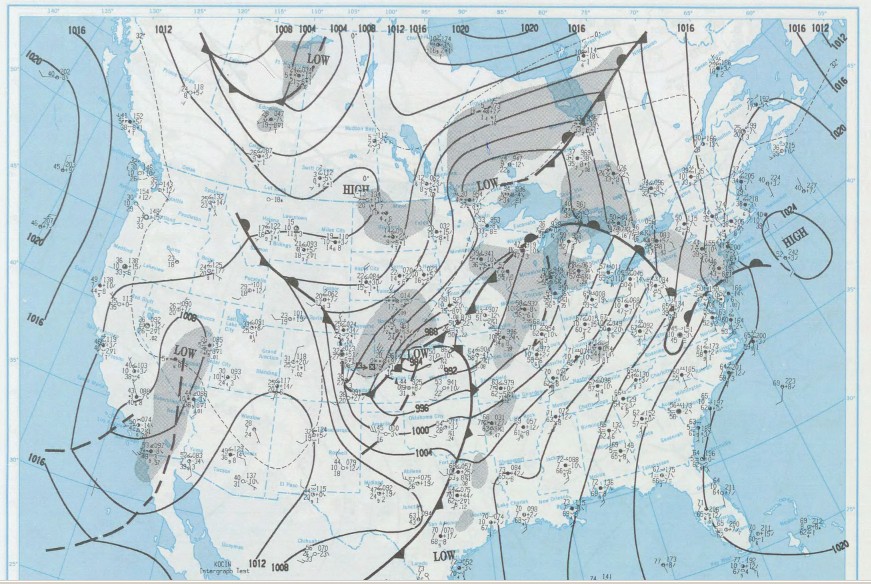
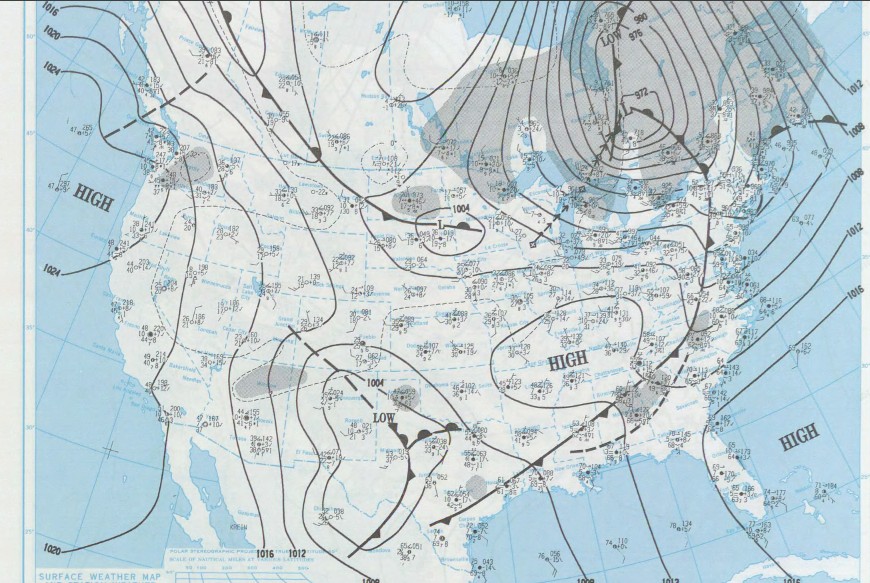
surface chart (Daily Weather Map) at 12z(morning)
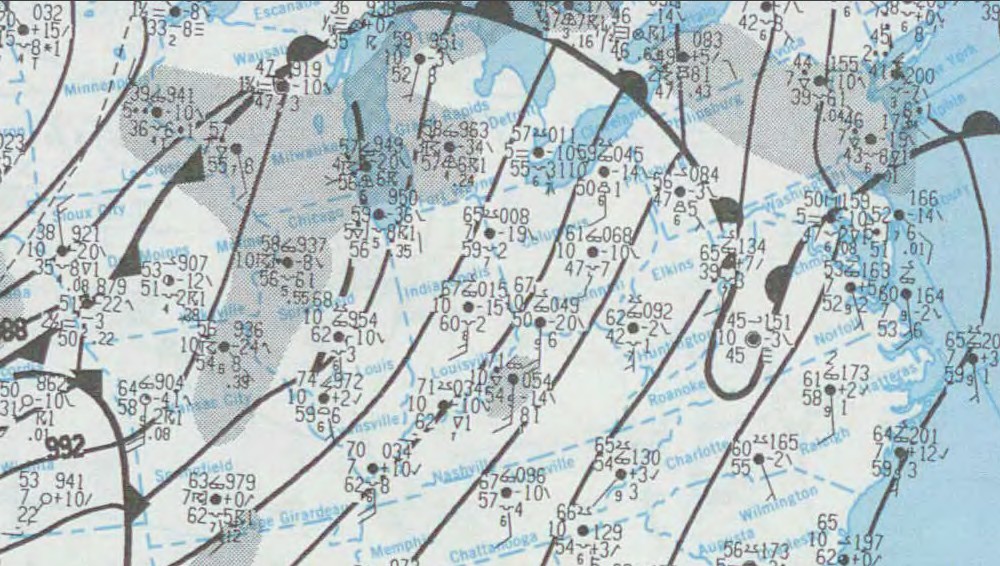
zoomed in surface chart from the daily weather map at 12z(morning)
March 28 (next day) surface chart (Daily Weather Map) at 12z(morning)
A complex surface low system - one low at the KS/NE border, and one near Thunder Bay ONT combined and lifted to near the James Bay, ONT/QC border, all within in 24 hours
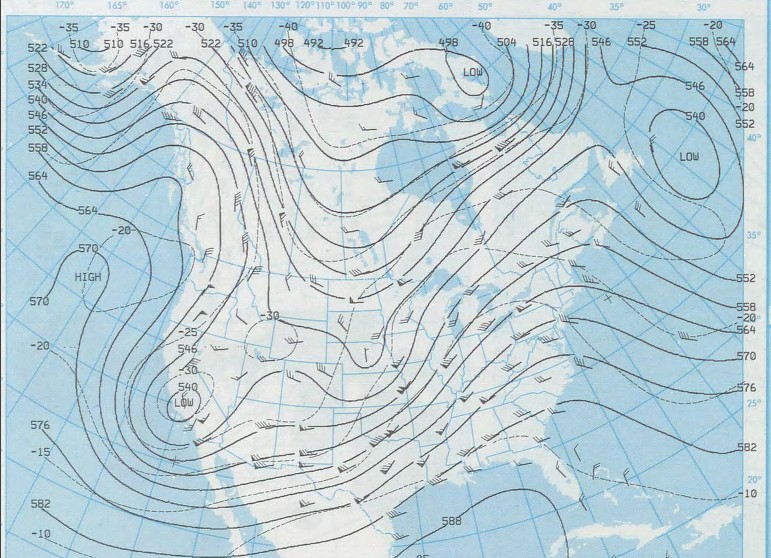
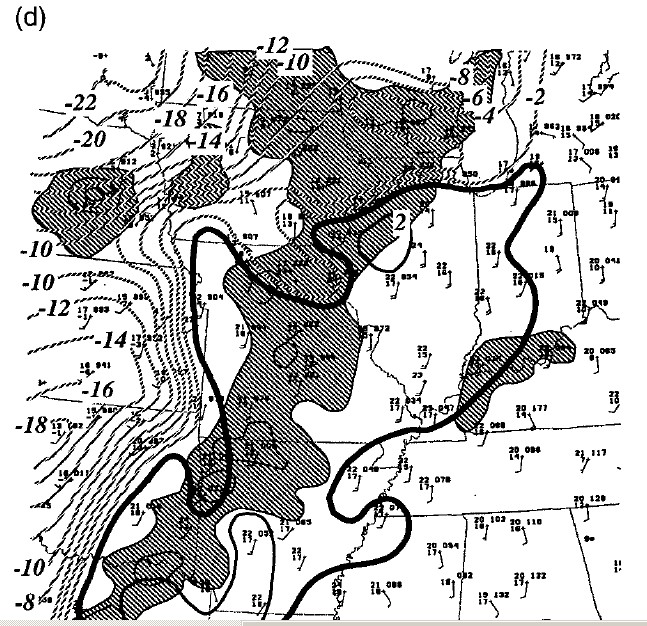
500mb chart from 12z (morning)
500mb chart from the daily weather map at 12z(morning)
500mb chart from 00z (evening)
An upper low in central Nebraska in the morning, a strong southwesterly jet (mid-level) , and by the evening, a shortwave had tracked to IL, cooling the 500mb temp by 2 degrees C at FNT and 5 degrees C at PIA
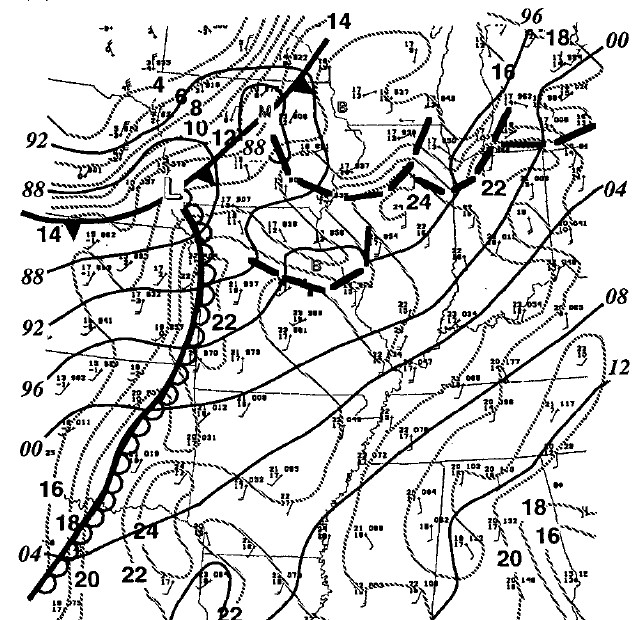
850mb chart from 12z (morning)
850mb chart from 00z (evening)
850mb temperature contours from 00z (evening)
PIA cooled 9 degrees C as a result of the cold front. The 850mb temperatures cooled during the day from about 14-15C to around 12-13C (due to mixing?). This was a factor in the destabilization of the air through the day.
In the morning, a very strong low-level jet of 50 knots or better associated with a surface low moving out from the Plains went from from northeast TX to central IL, and then in the evening, it was 40 to 60 knots or more through the whole OH valley and MI.
700mb chart from 00z (evening)
250mb chart from 12z (morning)
250mb chart from 00z (evening)
250mb wind speeds increased from about 70 knots to 80 knots during the day. The area also appears to be in a left exit region of a jet stream that is very noticeable.
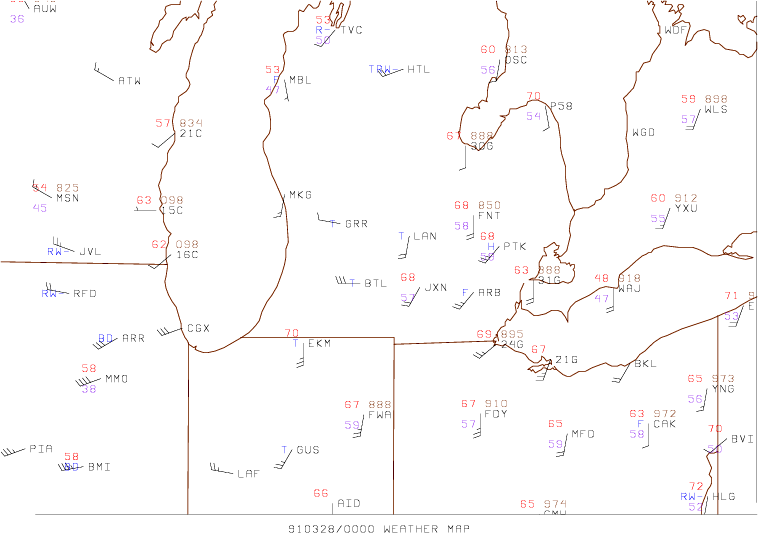
23z Regional Surface chart
00z Regional Surface chart
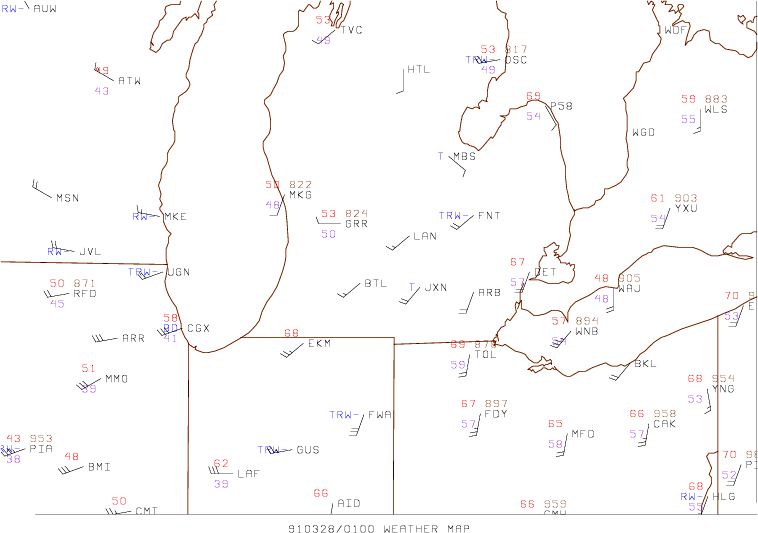
01z Regional Surface chart
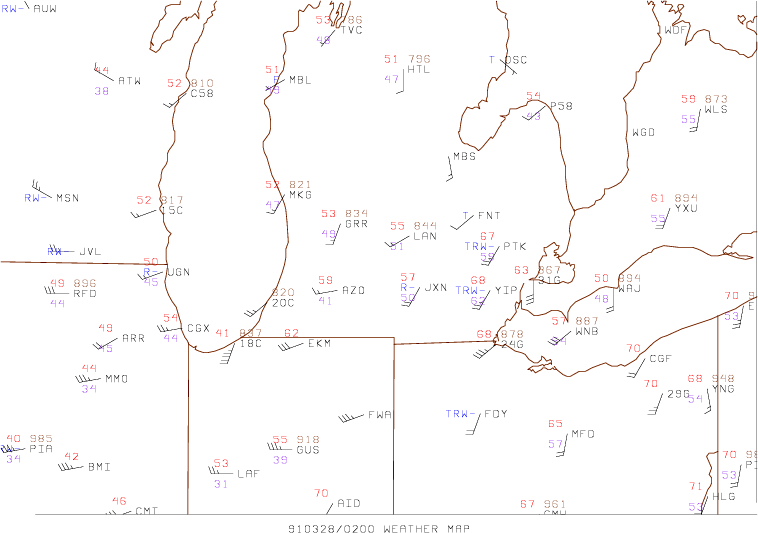
02z Regional Surface chart
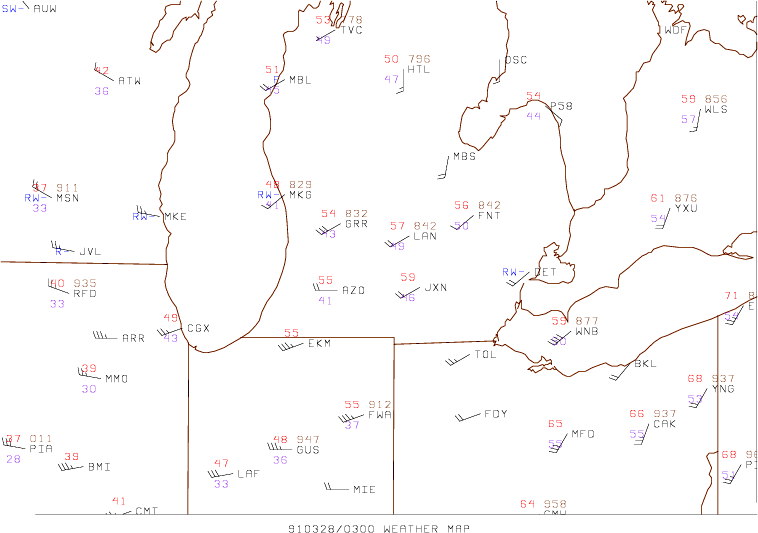
03z Regional Surface chart
12z negative of Lifted Index and Radar reflectivity (shaded) from Sanders and Doswell
12z surface potential temperature, fronts, and outflow boundaries from Sanders and Doswell
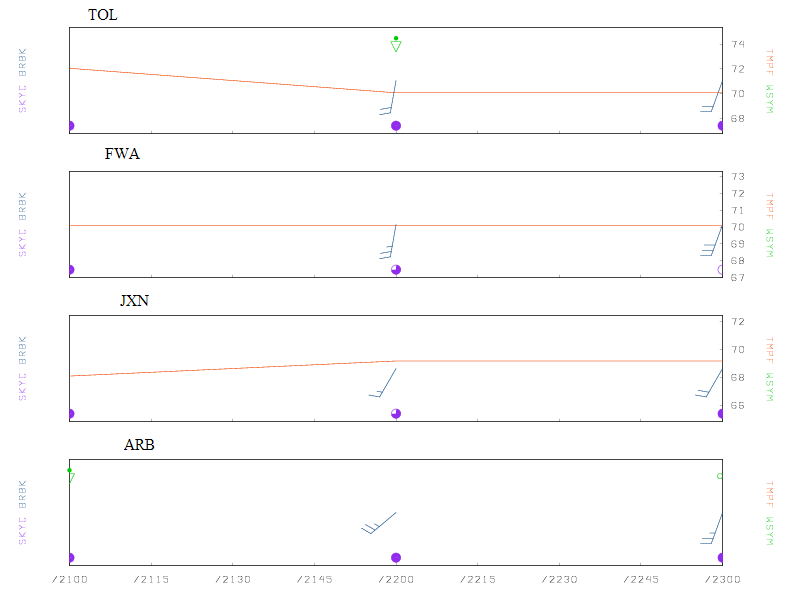
March 27 21Z to 23Z Meteograms for Toledo, Fort Wayne, and Jackson, Ann Arbor
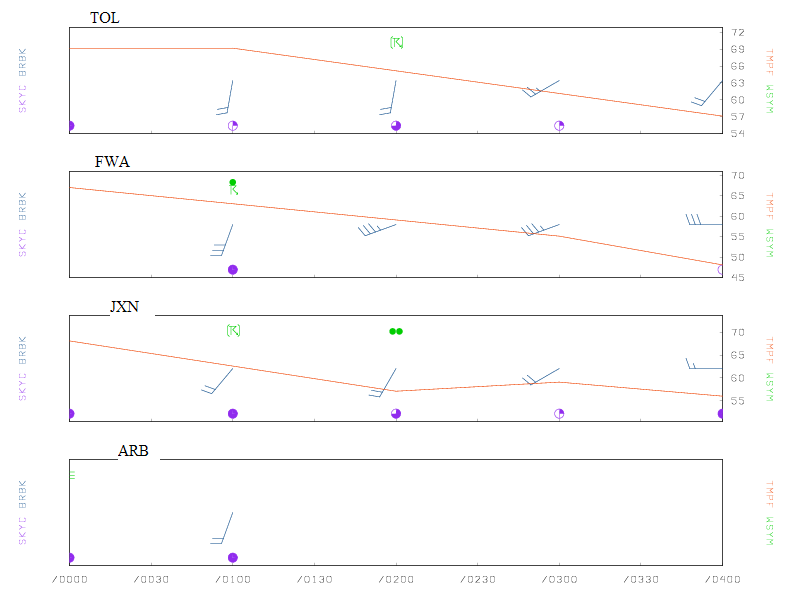
March 28 00z to 04z Meteograms for Toledo, Fort Wayne, and Jackson, Ann Arbor
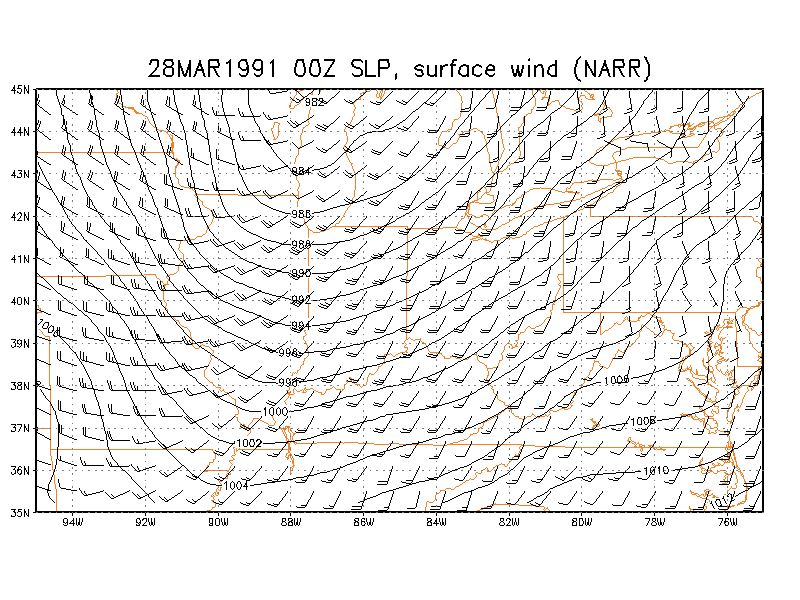
00z Surface wind and SLP (NARR)
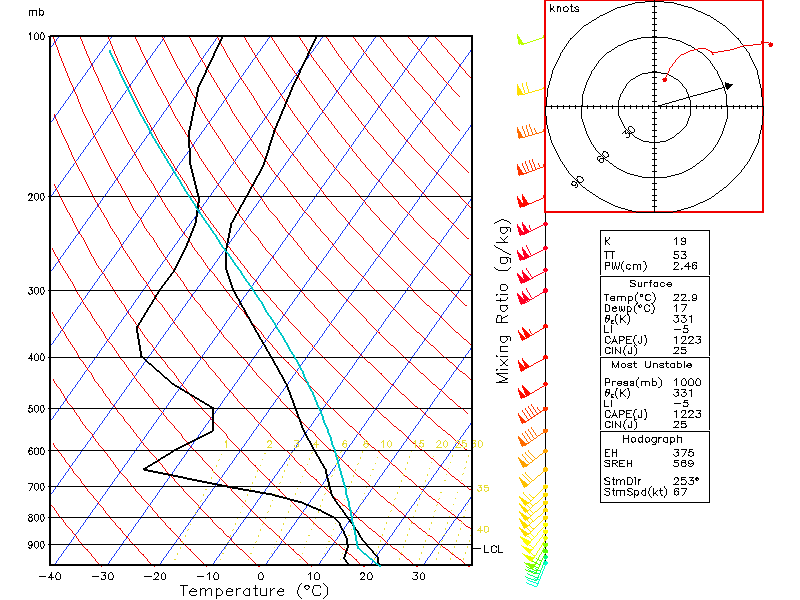
Skew-T for Toledo at 00z (NARR)
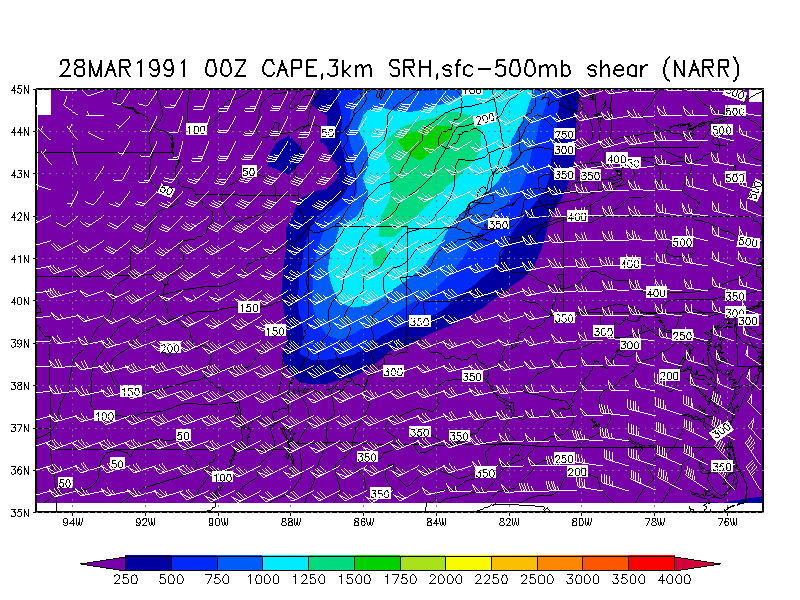
00z CAPE/3km Helicity/surface-500mb wind shear composite (NARR)
Sounding from Dayton OH (DAY) about 1 hours before the tornado occurred.
Sounding from Flint MI (FNT) about 1 hours before the tornado occurred.
discussion:
The data is incomplete, on the DAY sounding, however the helicity and 0-6km shear appear to be excellent anyway. It is likely this type of wind environment with a helicity of 250-300 m2/s2 or even higher existed at Steuben County/Williams County/Hillsdale County at that time. These soundings also look excellent for either supercells or squall lines.
The CAPE was about 1250-1500 J/kg at the time and place of the tornado, helicity was around 250-300 m2/s2, 0-6km shear was about 80 knots, all fine for supercell formation.
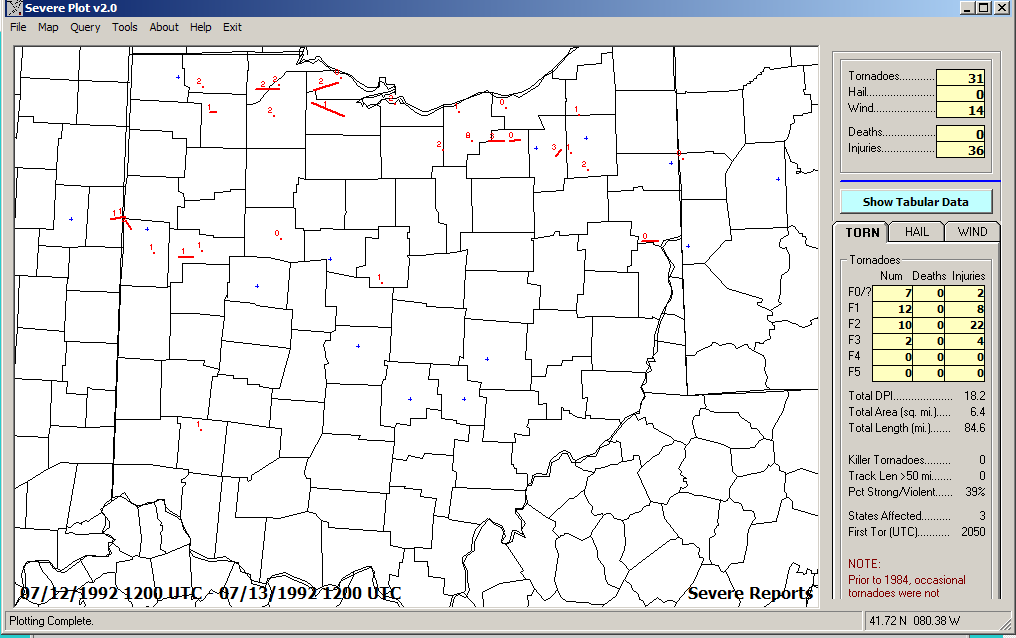
July 12, 1992
Storm Reports
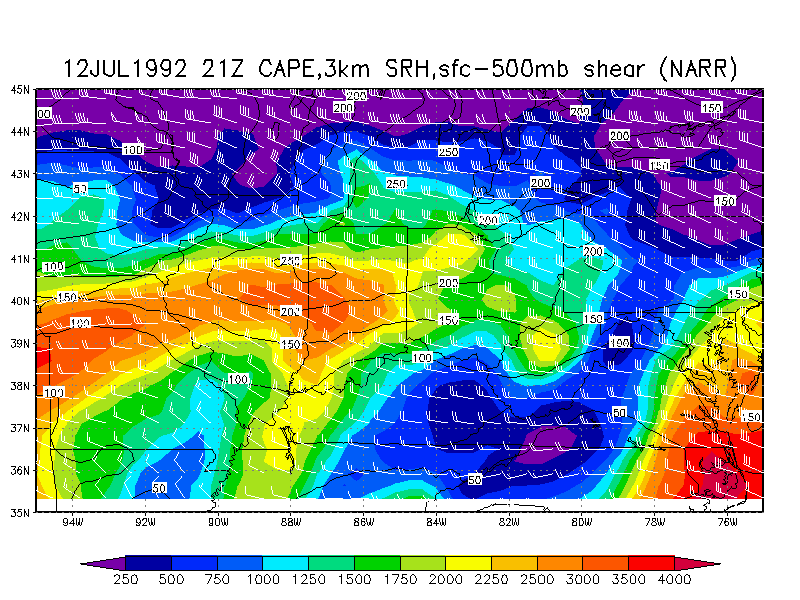
Surface CAPE was 1750 - 2200 J/kg, helicity was 200-300 m^2/s^2, 0-6km shear was 35-40 knots
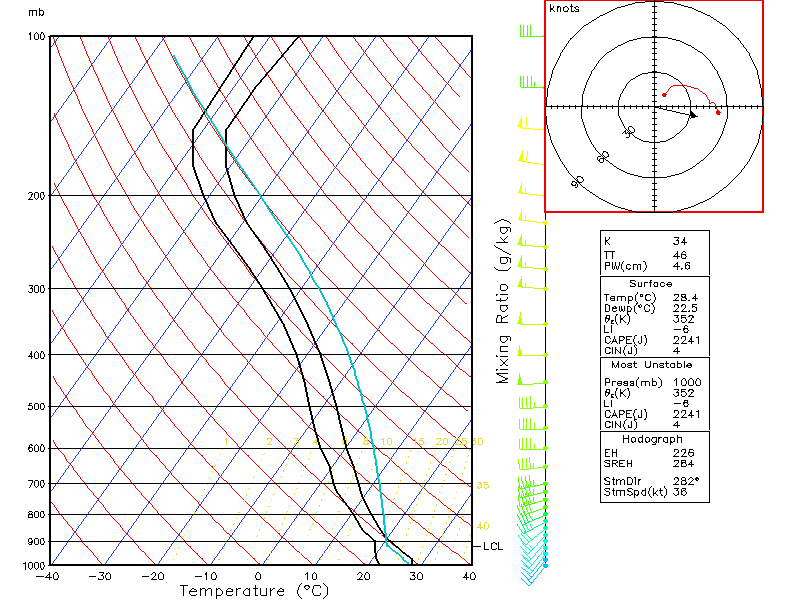
Sounding from Dayton OH (DAY) about 3 hours after the tornado occurred. The helicity (HEL) is excellent and the 0-6km shear is about 35-40 knots and the CAPE is about 1600J/kg
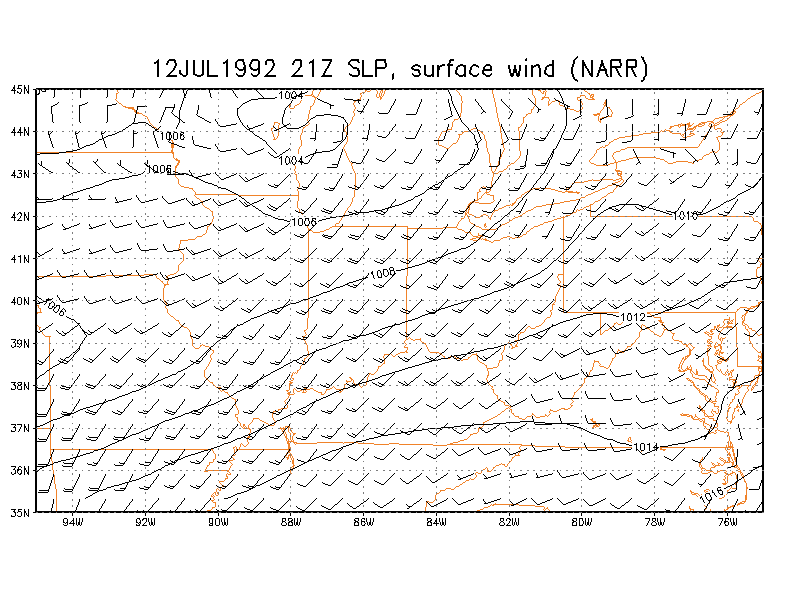
21z Surface wind and SLP (NARR)
Skew-T for Toledo at 21z (NARR)
21z CAPE/3km Helicity/surface-500mb wind shear composite (NARR)
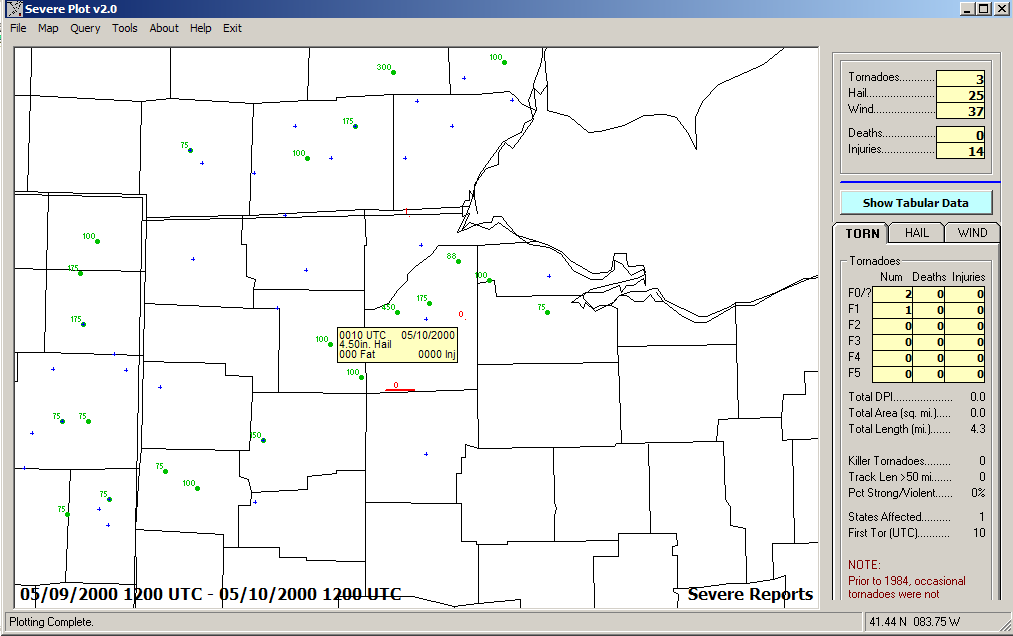
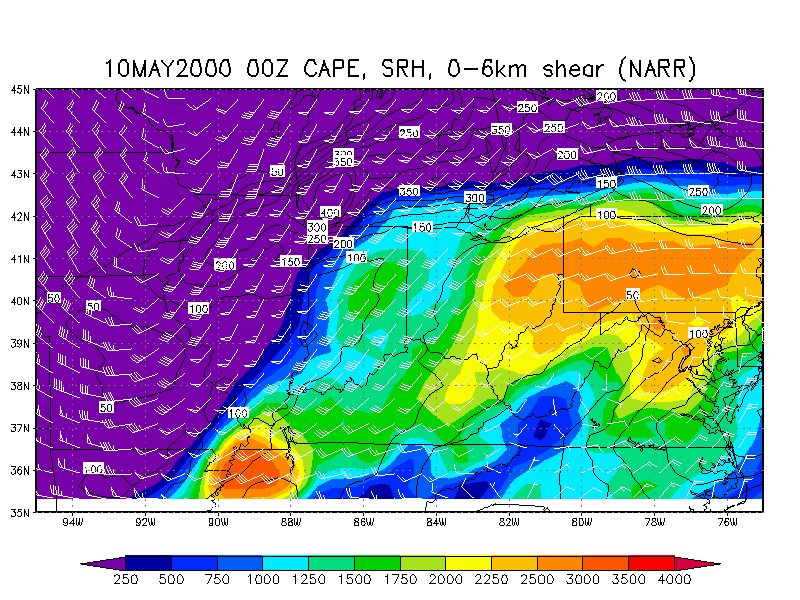
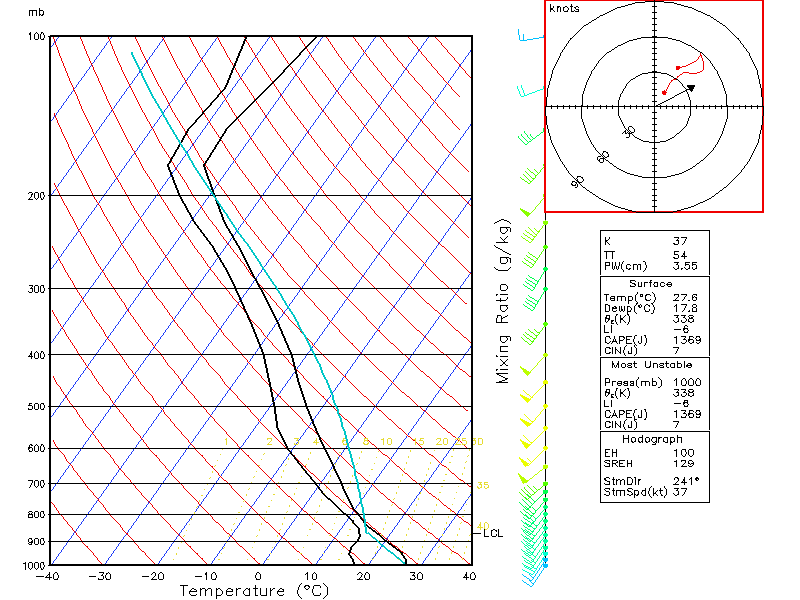
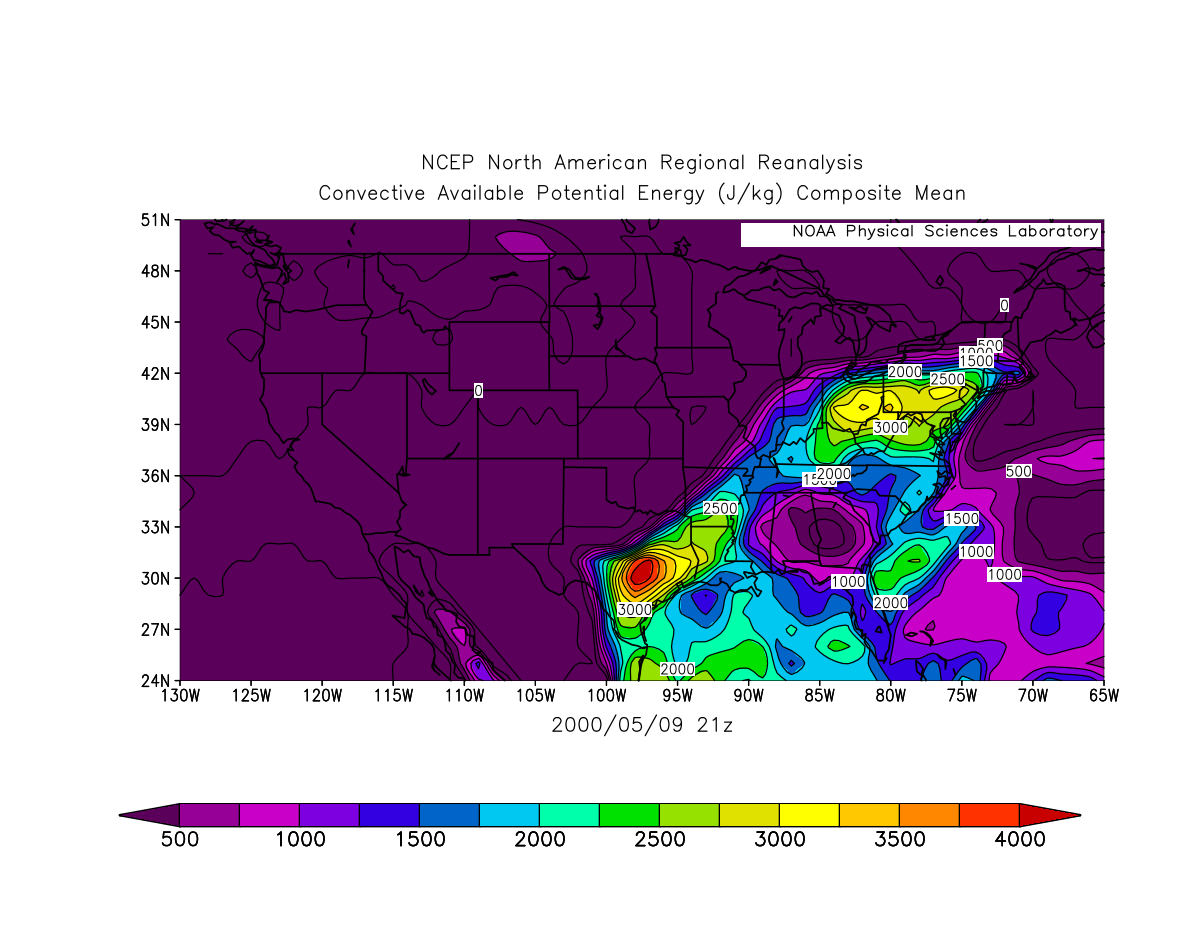
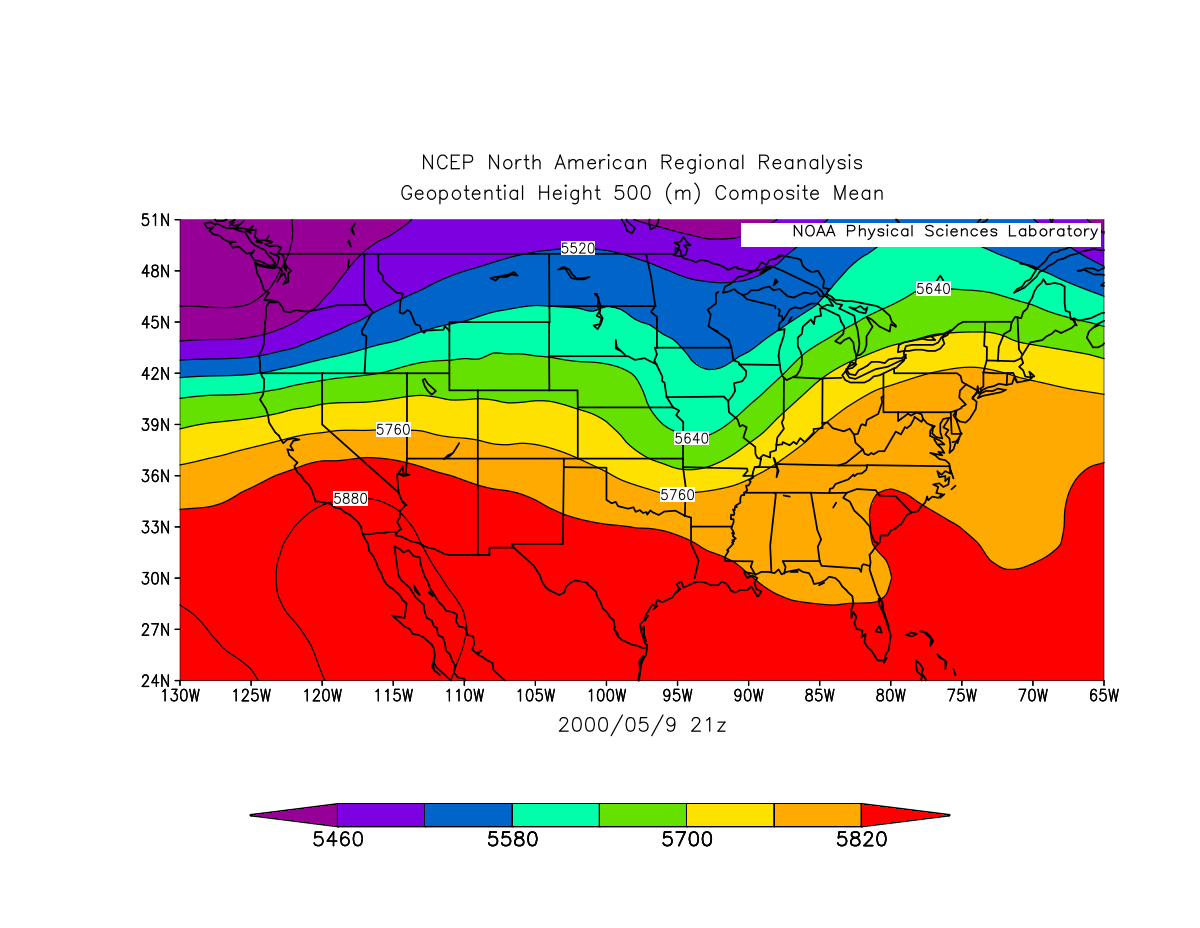
May 9, 2000
Storm Reports Sounding from Wilmington OH (ILN) about the time the tornadoes occurred. Note the boundary layer goes up to about 750mb (near dry-adiabatic lapse rates) - this is unusual.
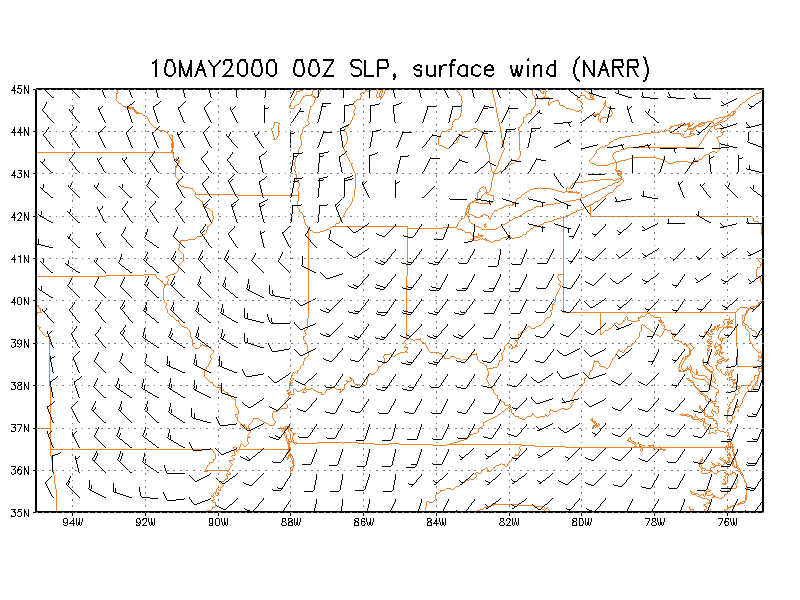
Surface Wind (NARR)
CAPE/surface-500mb shear/Helicity composite (NARR)
Skew-T for Toledo at 00z (NARR)
CAPE was about 1000 to 1300 J/kg, Helicity was 100 to 150 m2/s2, 0-6km shear was about 50 knots.
21z CAPE
21z 500mb map
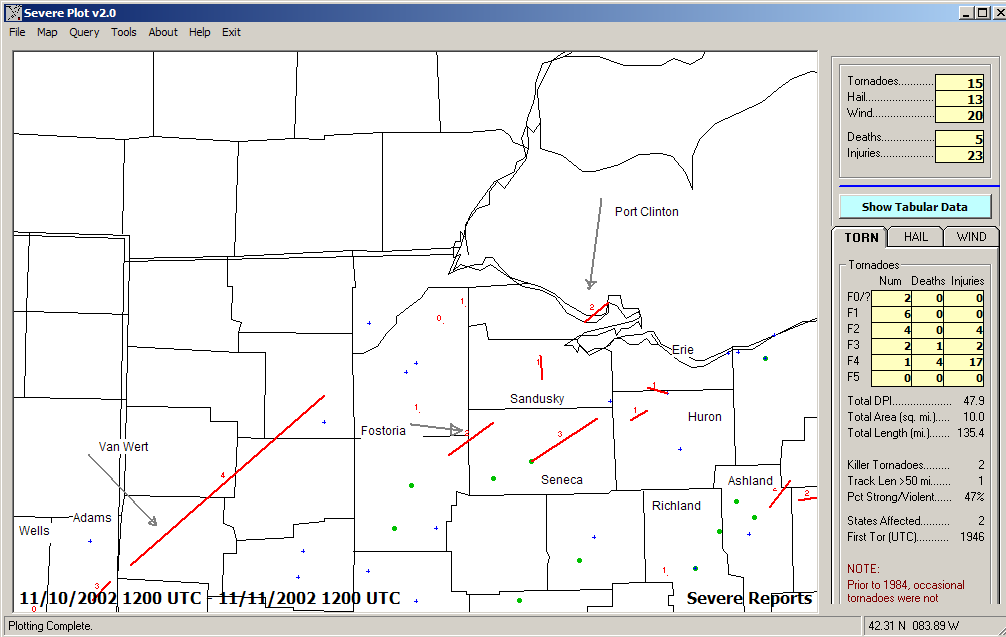
November 10, 2002 Tornadoes and Severe Storms
Storm Reports
Tornado paths graphic (preliminary surveys by the NWS)
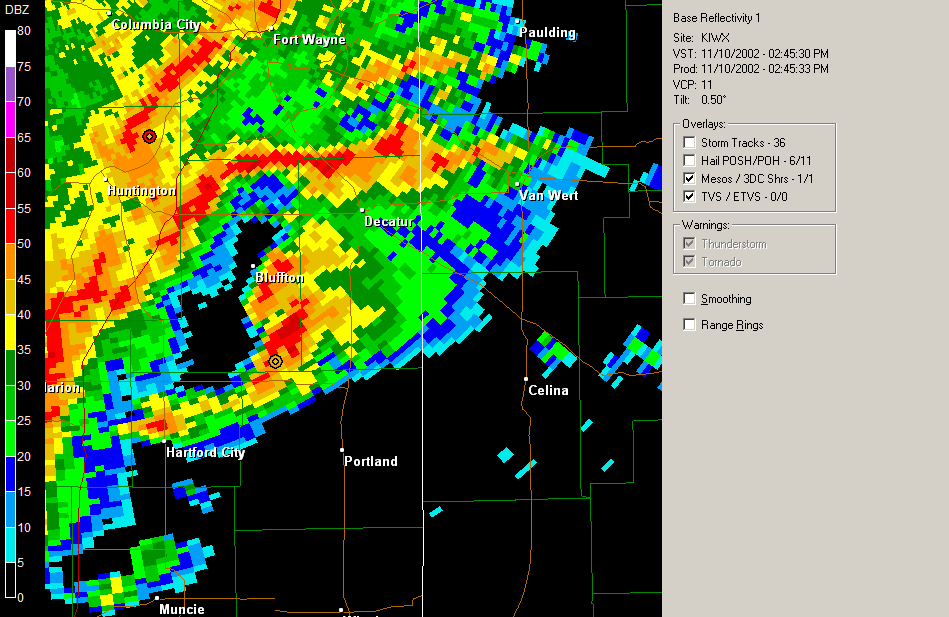
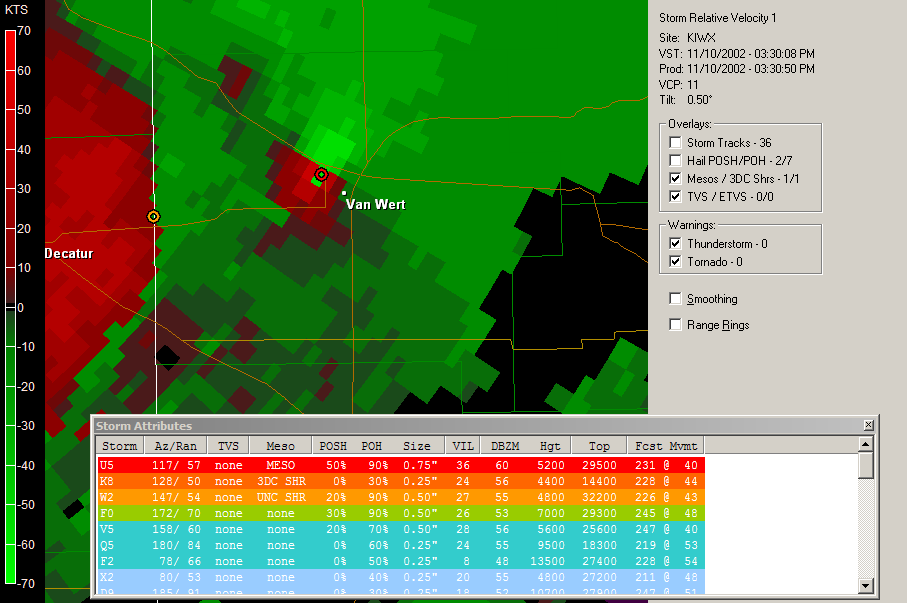
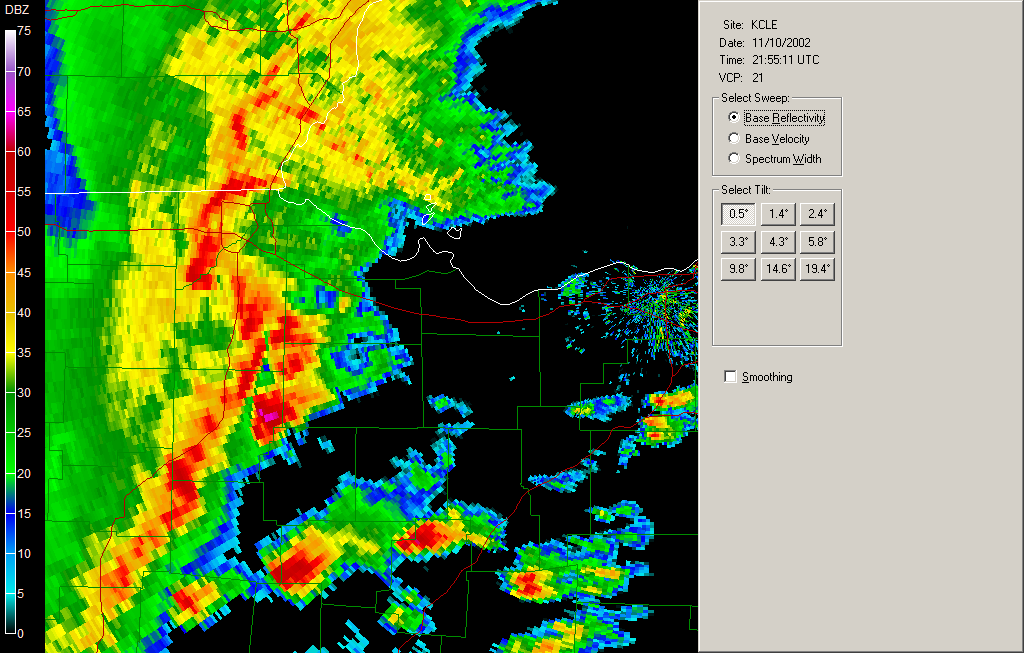
The most damaging tornadoes were the Van Wert and Continental (F4) 90-mile-long track tornado, Fostoria (F2), and Port Clinton (F2), an (F3) in Seneca County and an (F3) in Adams County, Indiana.
These were produced by supercells, the first of which formed in northeast Indiana near Hartford City, in Blackford County
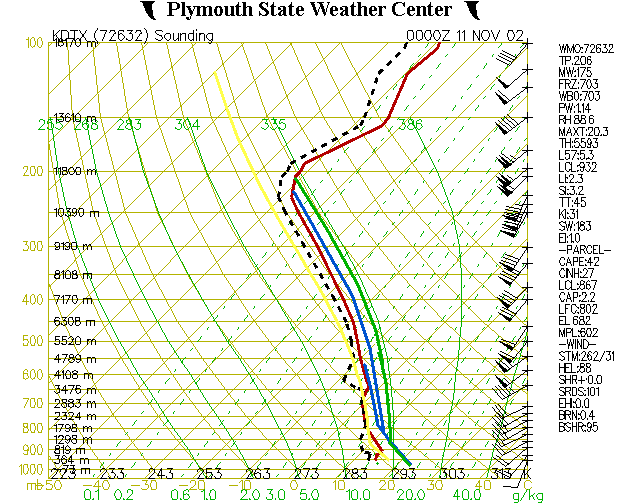
Skew-T for Findlay at 18z (NARR)
Skew-T for Findlay at 21z (NARR)
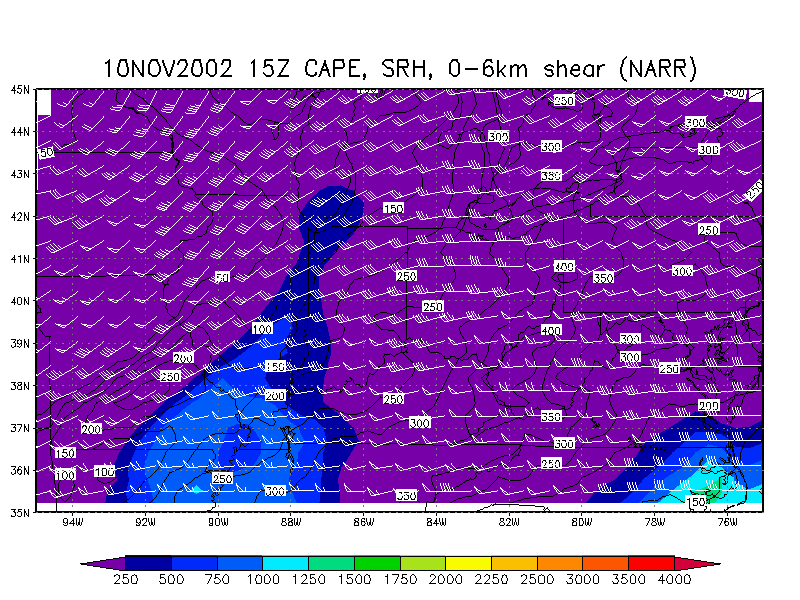
15z CAPE/3km Helicity/surface-500mb wind shear composite (NARR)
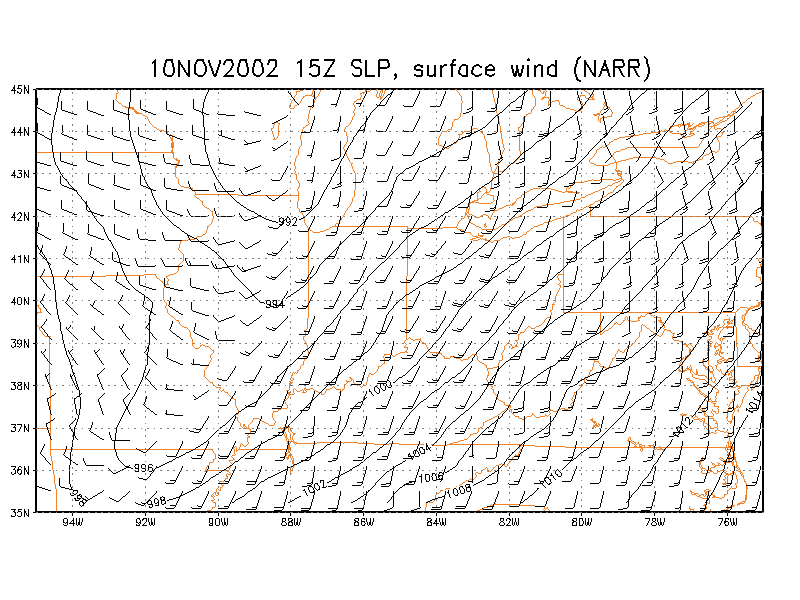
15z Surface wind and SLP (NARR)
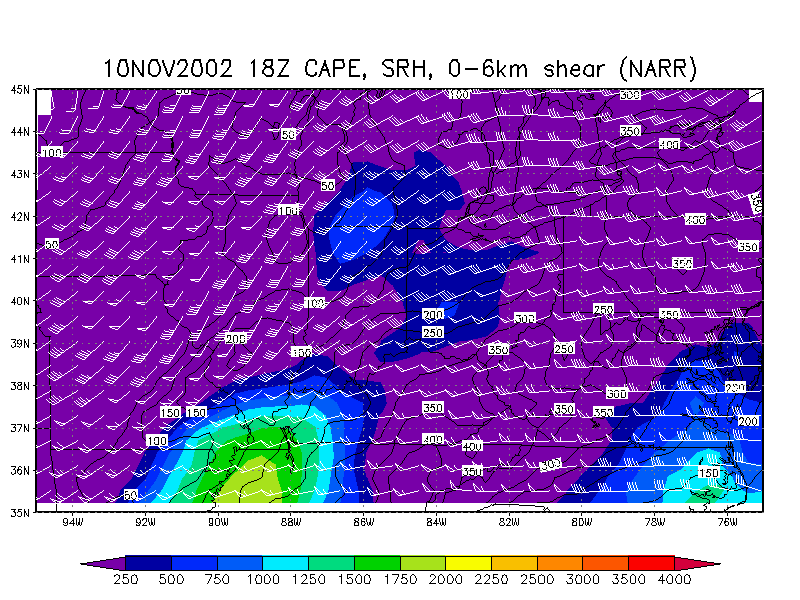
18z CAPE/3km Helicity/surface-500mb wind shear composite (NARR)
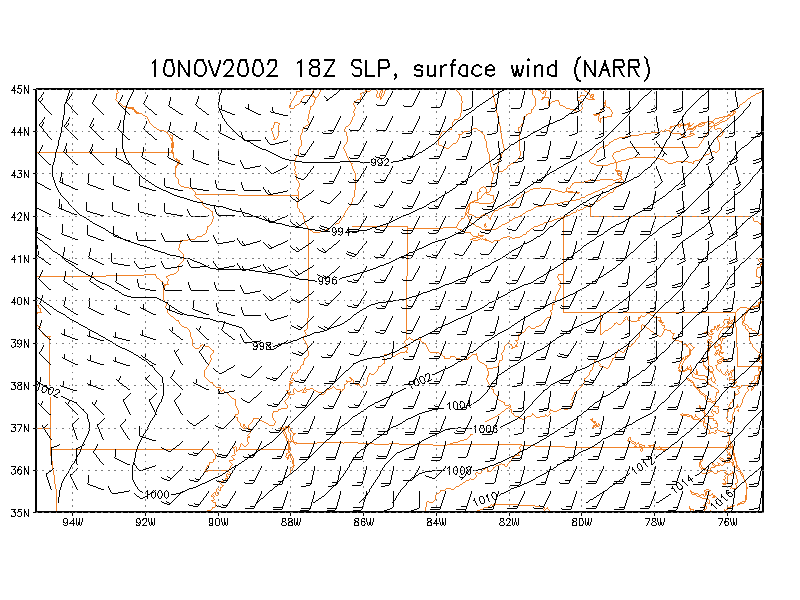
18z Surface wind and SLP (NARR)
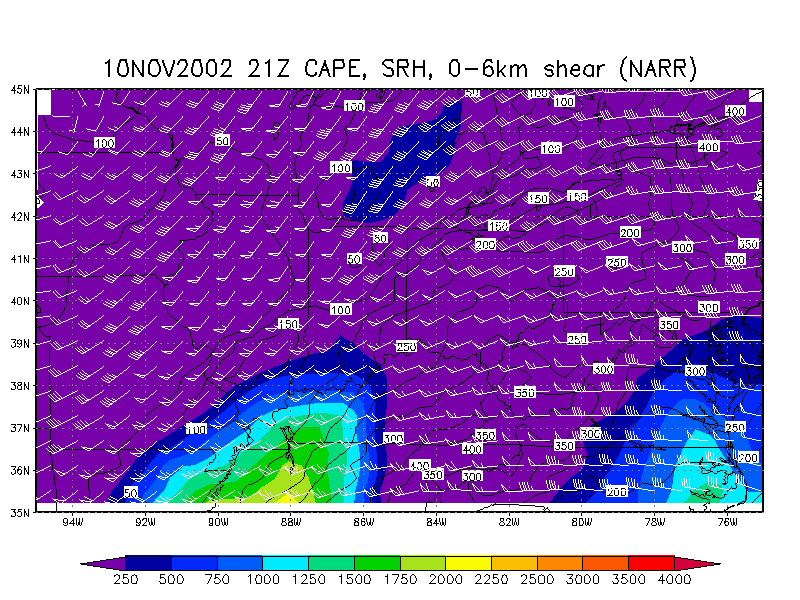
21z CAPE/3km Helicity/surface-500mb wind shear composite (NARR)
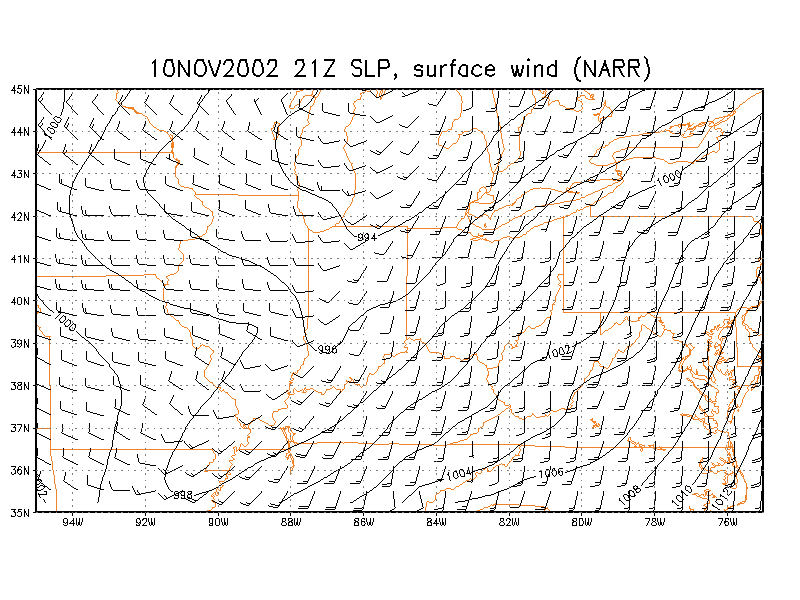
21z Surface wind and SLP (NARR)
discussion: Surface CAPE was 50 to 100 J/kg, helicity (SRH) was 150 to 200 m^2/s^2, 0-6km shear was 45-50 knots, my guess is that 0-1km EHI may have been as high as 0.8 to 1.5, at around 20Z or 21Z
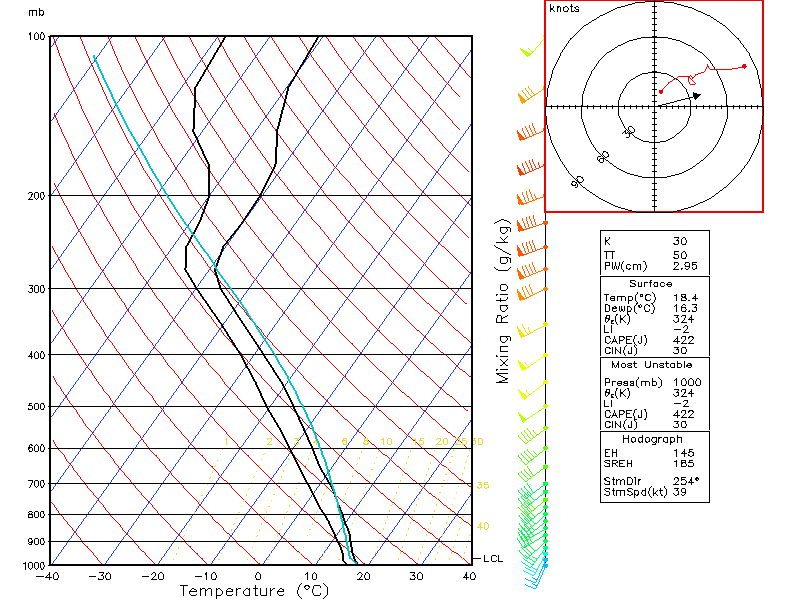
Sounding from Wilmington OH (ILN) about 8 hours before the first tornado occurred.
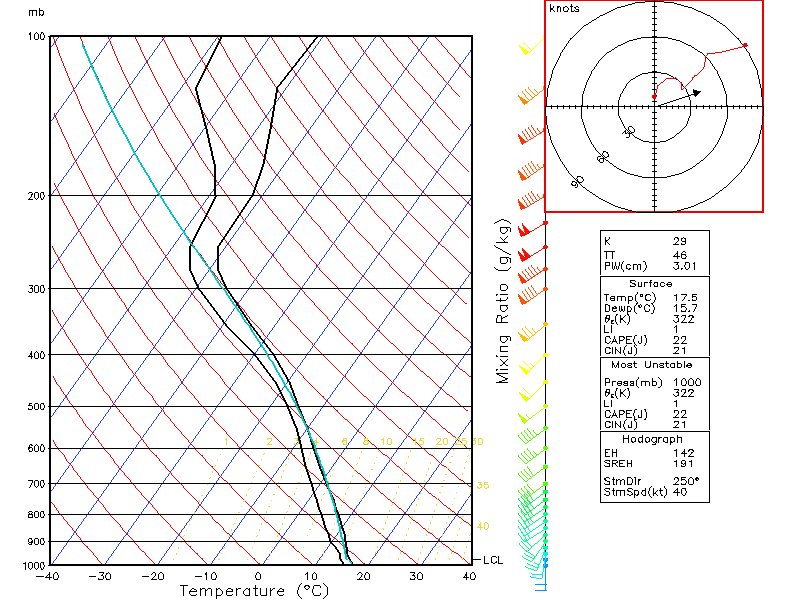
Sounding from Wilmington OH (ILN) about 4 hours after the first tornado occurred, or less than 4 hours from the time most of the tornadoes occurred. The data is incomplete, but you can see that the helicity (SRH) should have been more than 615 m^2/s^2, and the 0-6km shear and CAPE are unknown.
Sounding from Pontiac/Detroit (DTX) after the tornado occurred. This is kind of unimpressive except for the 0-6km shear.
Sounding from Pontiac/Detroit (DTX). I modified this to include some possibilities of what the sounding might have looked like in NW OH in the afternoon. The blue lines are possible temperature profiles. The green line is the parcel profile with a surface temperature of about 70F, dew point of 61F (21C, 16C). So the sounding may have had over 500 J/kg of CAPE after all. There may have been a "skinny" CAPE of about 300-700 J/kg in NW OH. It is still somewhat puzzling how a low-CAPE environment produced a monster F4 tornado.
Start Times of the tornadoes
Wells County 1946z (2:46pm)
Adams County 1958z (2:58pm)
Van Wert 2015z (3:15pm)
Fostoria 2157z (4:57pm)
Seneca County 2215z (5:15pm)
Sandusky County 2219z (5:19pm)
Port Clinton 2230z (5:30pm)
completely in Huron County 2242z (5:42pm)
western Richland County 2245z (5:45pm)
Erie County 2249z (5:49pm)
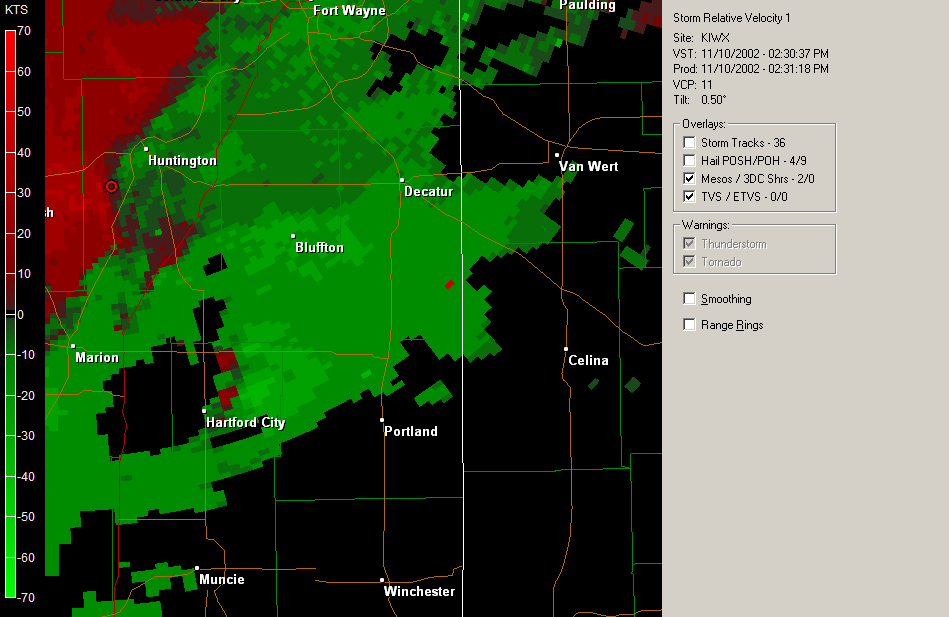
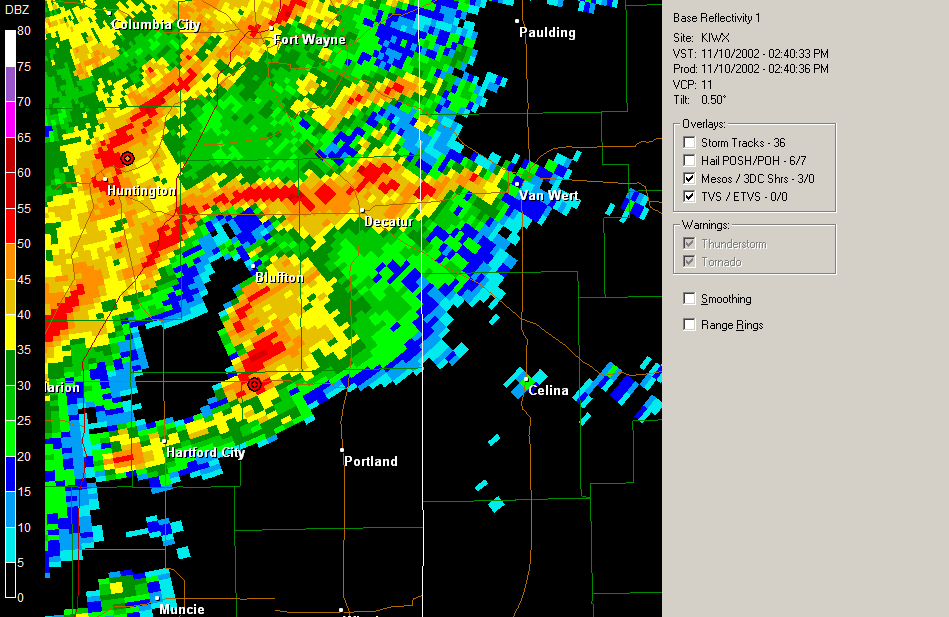
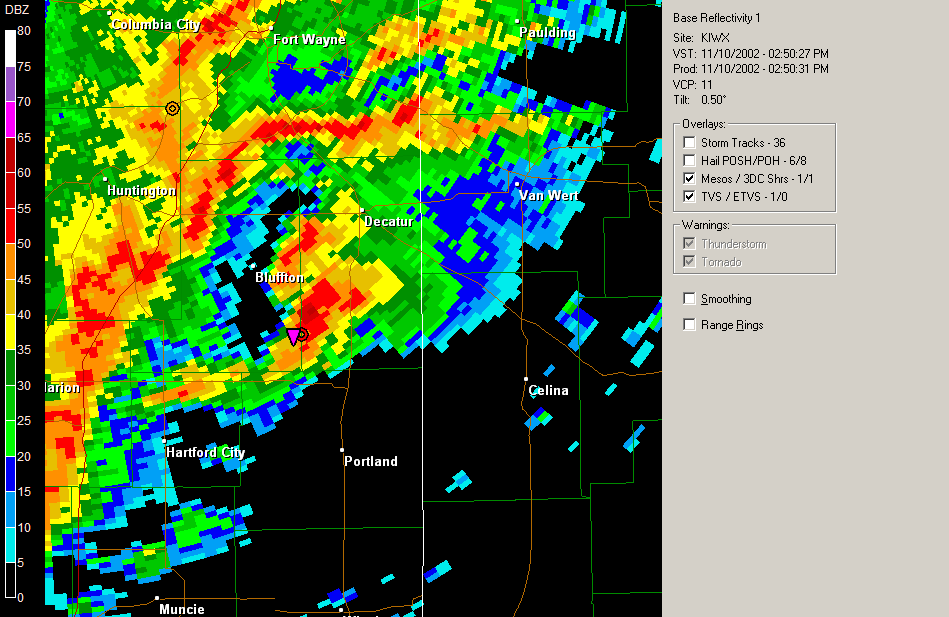
Van Wert Tornado Loops
Base Reflectivity 1
Base Reflectivity 2
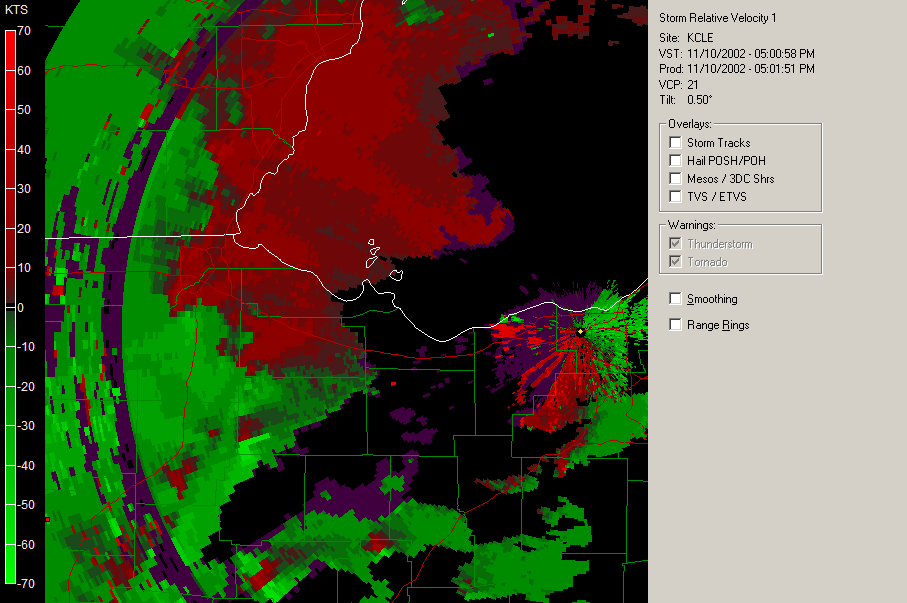
Storm Relative Velocity 1
Storm Relative Velocity 1 - Zoomed in
Radar images
1930z IWX storm relative velocity 1 zoomed on NE Indiana
1930z_IWX_base_reflectivity_1_zoomed on NE Indiana
1940z_IWX_base_reflectivity_1_zoomed on NE Indiana
1945z_IWX_base_reflectivity_1_zoomed on NE Indiana
1950z_IWX_base_reflectivity_1_zoomed on NE Indiana
2030z_IWX_storm_rel_velocity_1 zoomed on Van Wert Tornado
2155Z_CLE_base_reflecticity_1
2155z_CLE_base_reflectivity_1_zoomed on NW Ohio
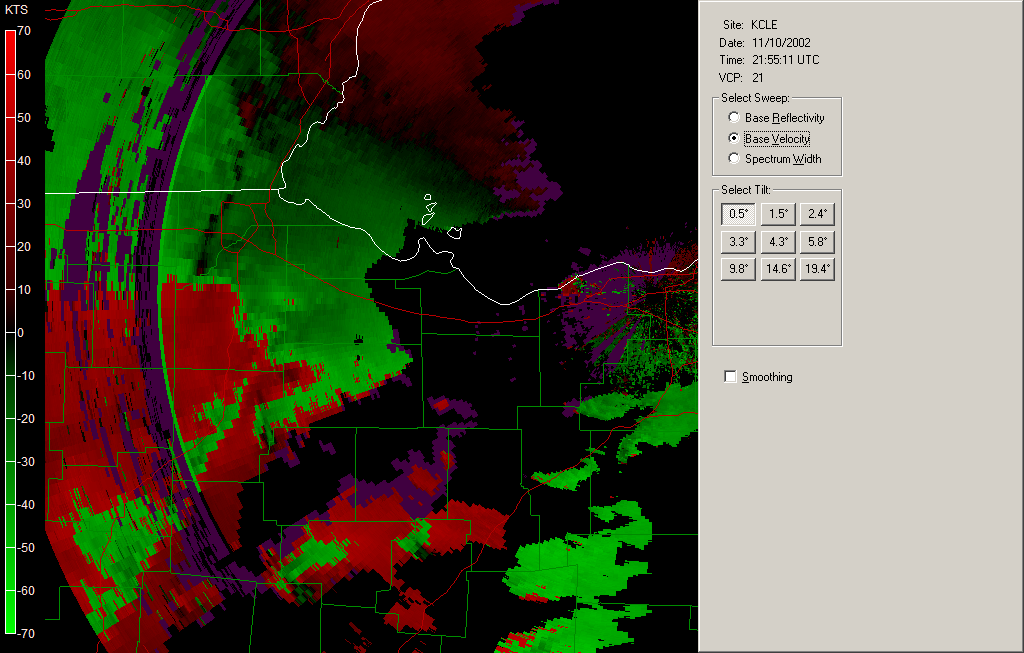
2155z_CLE_base_velocity_1_zoomed on NW Ohio
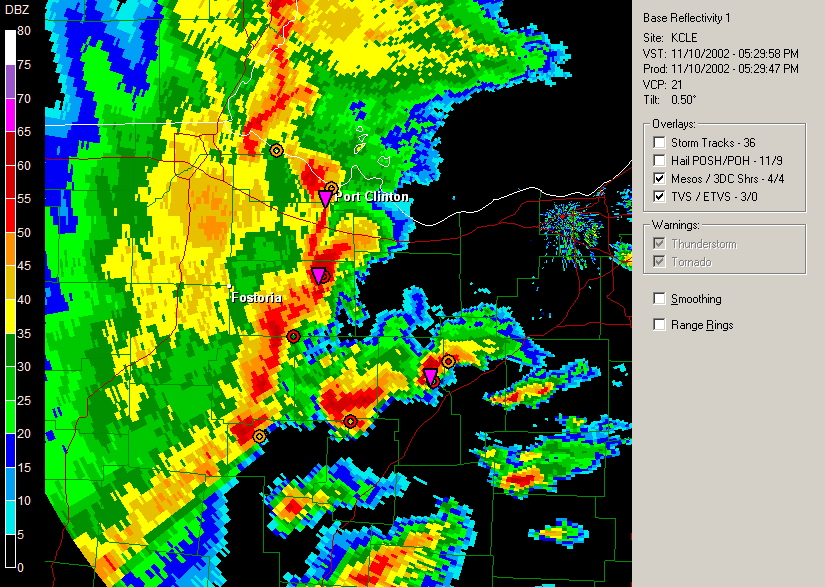
2200z_CLE_base_reflectivity_1_zoomed on NW Ohio - Fostoria Tornado was occurring
2200z CLE_level 3 nexrad_base_reflectivity_1_zoomed on NW Ohio - Fostoria Tornado was occuring
2200z_CLE_level 3 nexrad_storm_rel_velocity_1_zoomed on NW Ohio - Fostoria Tornado was occurring
2224z_CLE_base_reflectivity_1 zoomed on NW Ohio- Seneca County Tornado occurring
2229z_CLE_base_reflectivity_1 zoomed on NW Ohio - Port Clinton Tornado was occurring
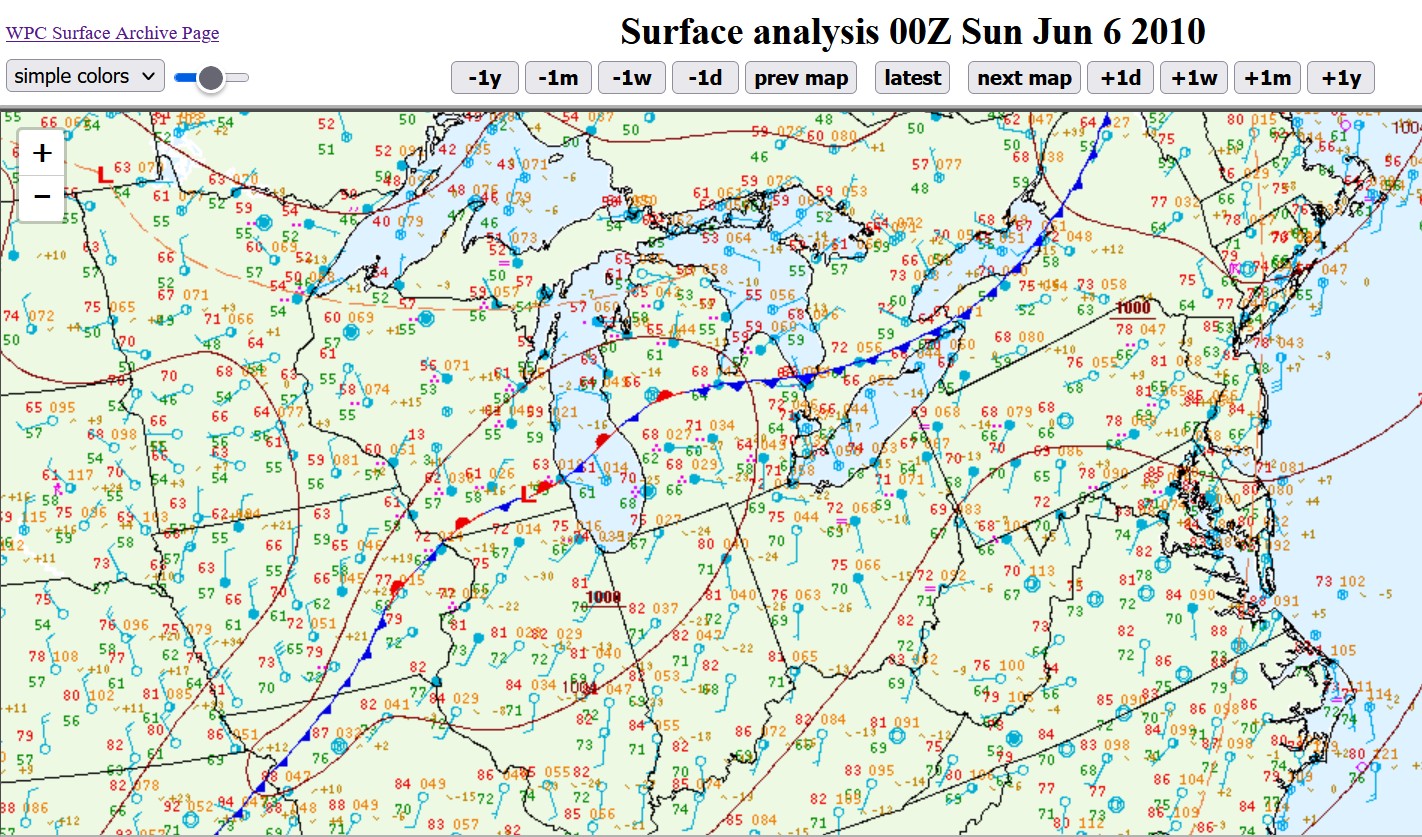
June 5, 2010
Two tornadoes hit west of Toledo at about 10:38PM near the Fulton County/Lucas County line. One large
violent tornado hit near Lake Township, Millbury, and Moline at about 11:20-11:30PM. Three tornadoes happened in the southern
Michigan area adjacent to Toledo. The NWS says this in their storm survey of the western Lucas County tornado: "A tornado with a rating of EF1
first touched down at State Route 64 and the county line. The tornado moved northeast to the intersection of Reed and Spencer Road."
The EF4 tornado at Lake Twp./Millbury/Moline was the worst tornado in the Toledo area since 1965. There was significant damage
to Lake High School and there were 5 deaths in Millbury.
This was a situation where storms developed near a warm front/stationary front late at night with strong instability and strong wind shear.
Tornado Tracks
Supercell Composite Parameter
Significant Tornado Parameter
300mb map
500mb map
850mb map
Surface map (00z)
Surface map (03z)
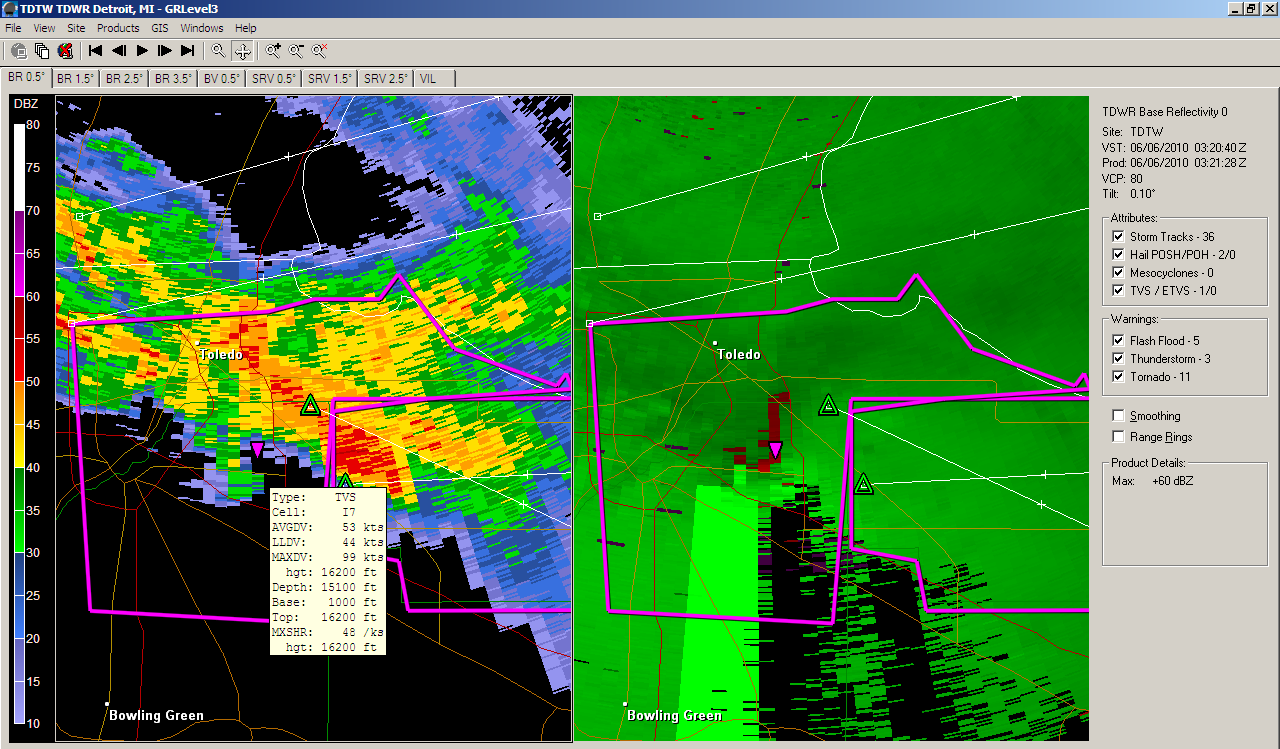
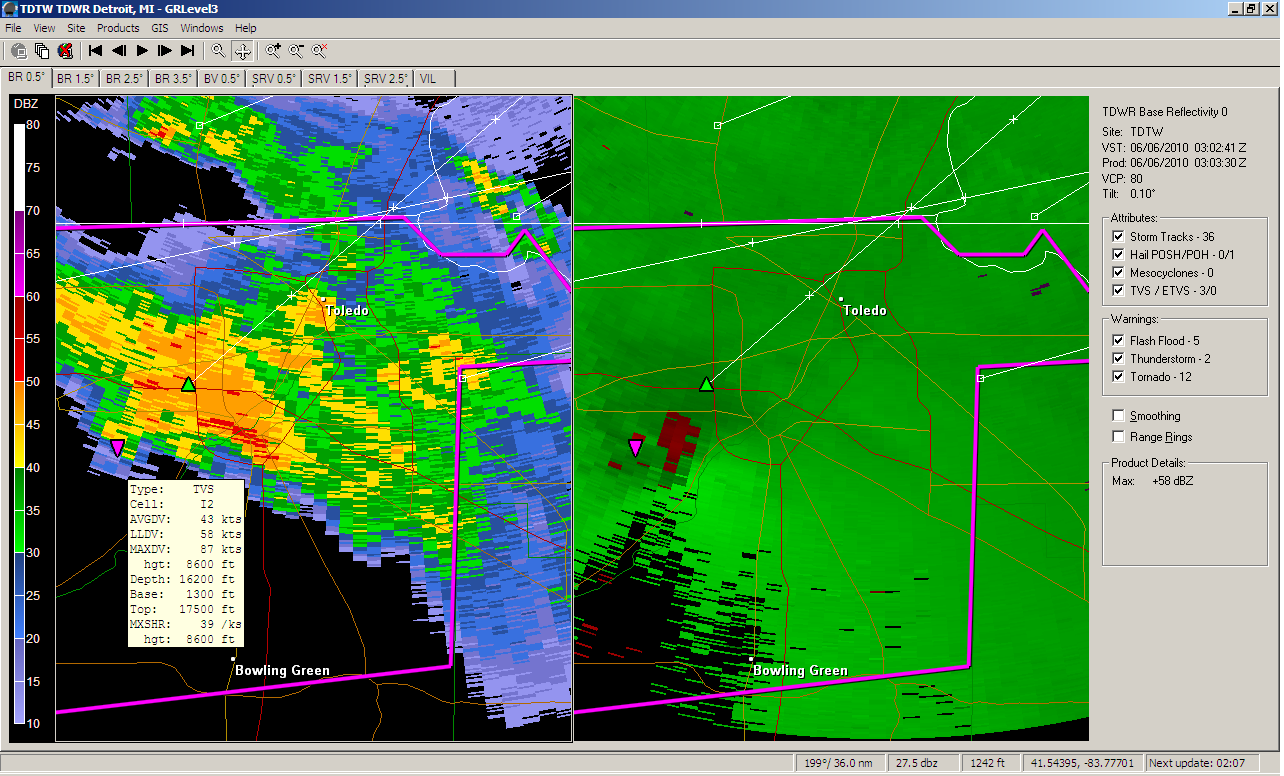
Radar image (0311z)
Radar image 11:20pm
Radar image 11:02pm
Tornado reports and warnings
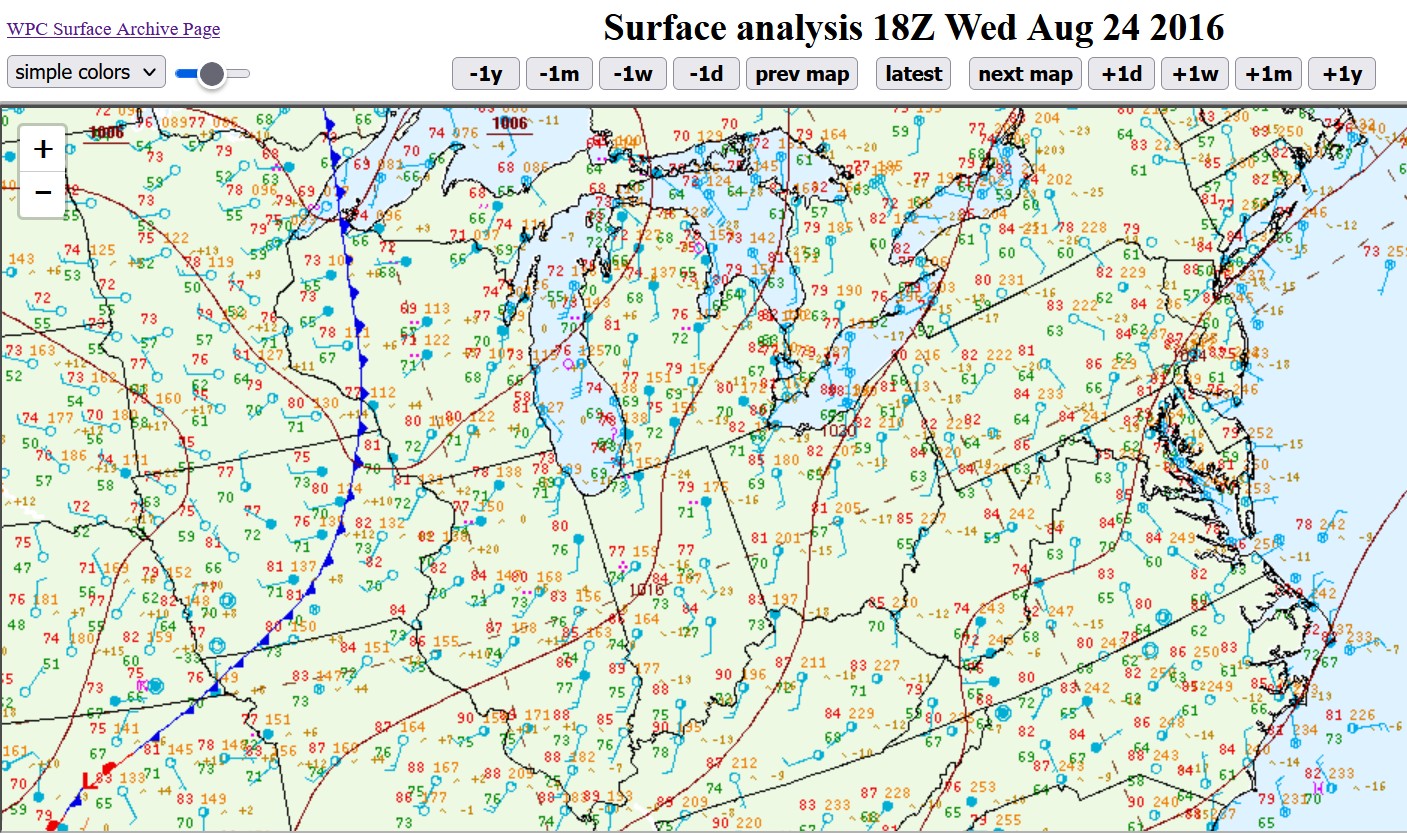
August 24, 2016
A surprise tornado outbreak happened in late summer with 11 tornadoes in Ohio and 11 tornadoes in Indiana.
There was a weak surface weather pattern.
A cold front was in Wisconsin, and surface temperatures were in the 80's with dew points near 70,
to the low 70's in Indiana and Illinois. Several tornadoes happened outside the SPC slight-risk outlook, particularly
in Ohio.
Storm Report Map
SPC mesoscale discussion (1)
SPC mesoscale discussion (2)
SPC mesoscale discussion (3)
SPC Outlook verification
Supercell composite parameter
Significant tornado parameter
Surface map (18z)
0-6 km shear map
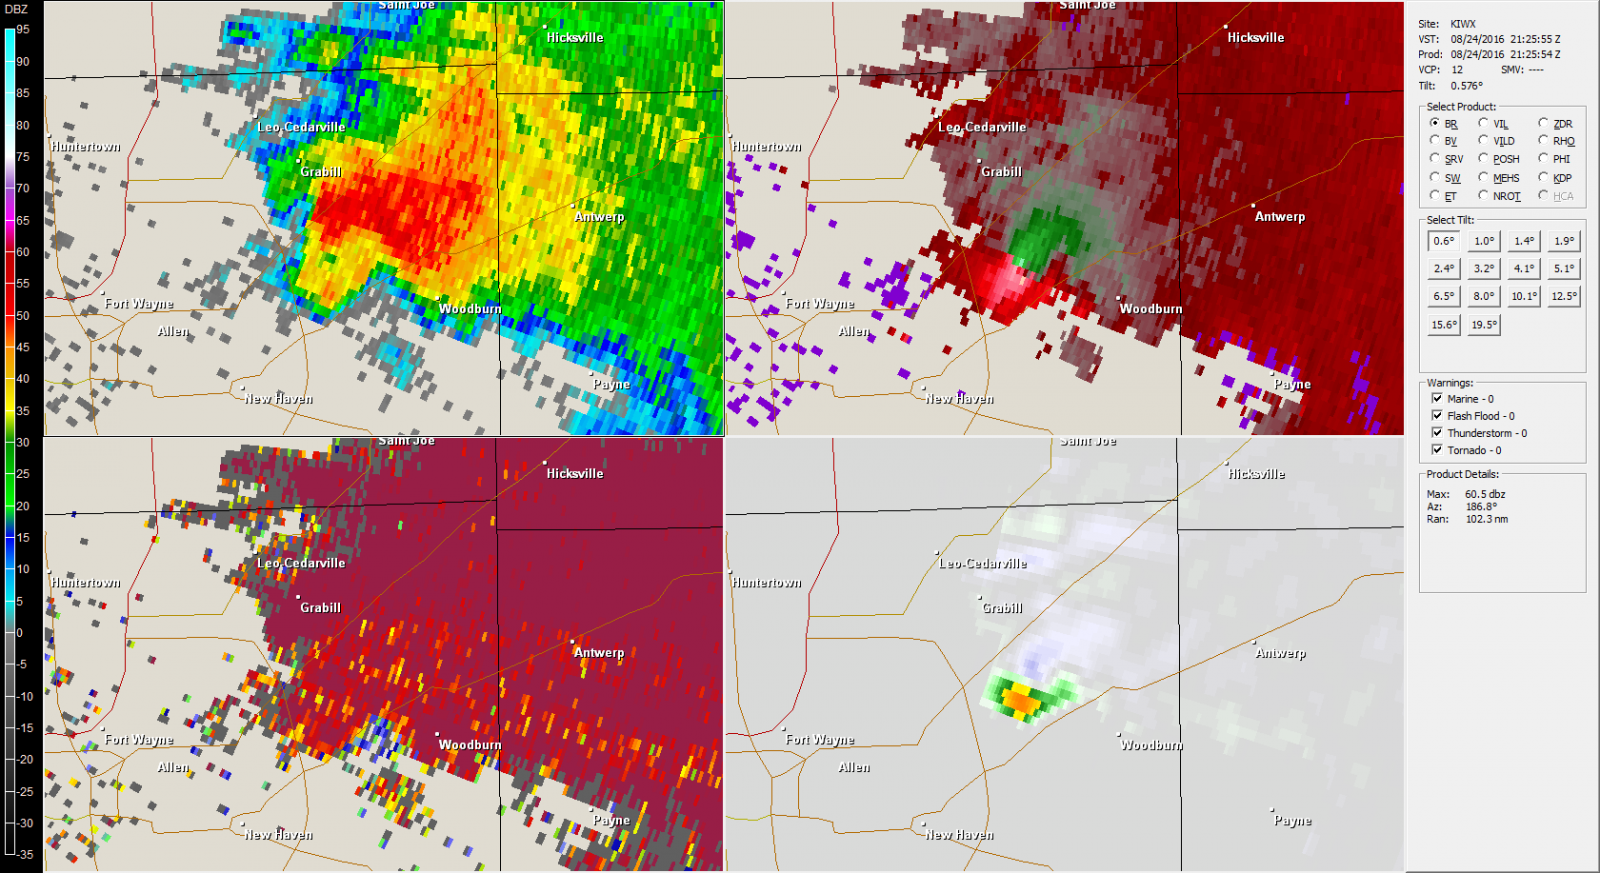
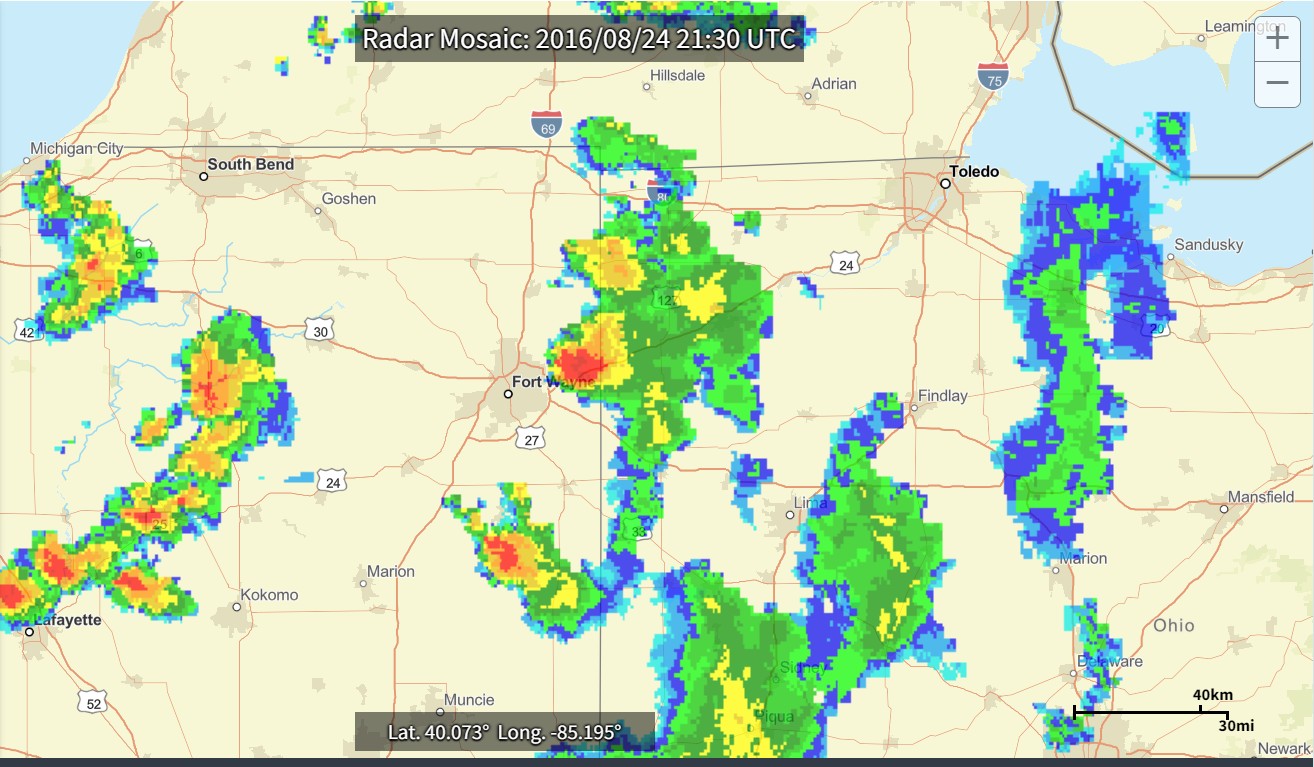
radar image from NWS-Indiana
Significant Tornado Parameter and radar
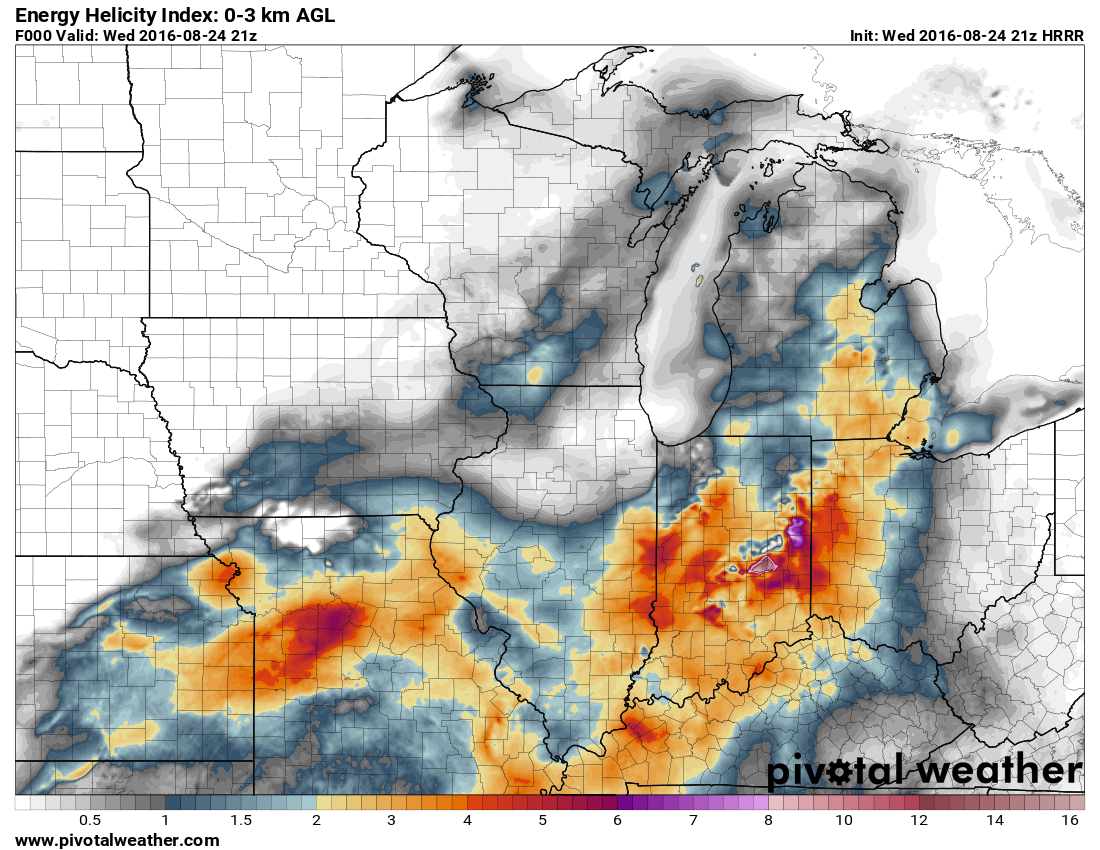
Energy-Helicity Index
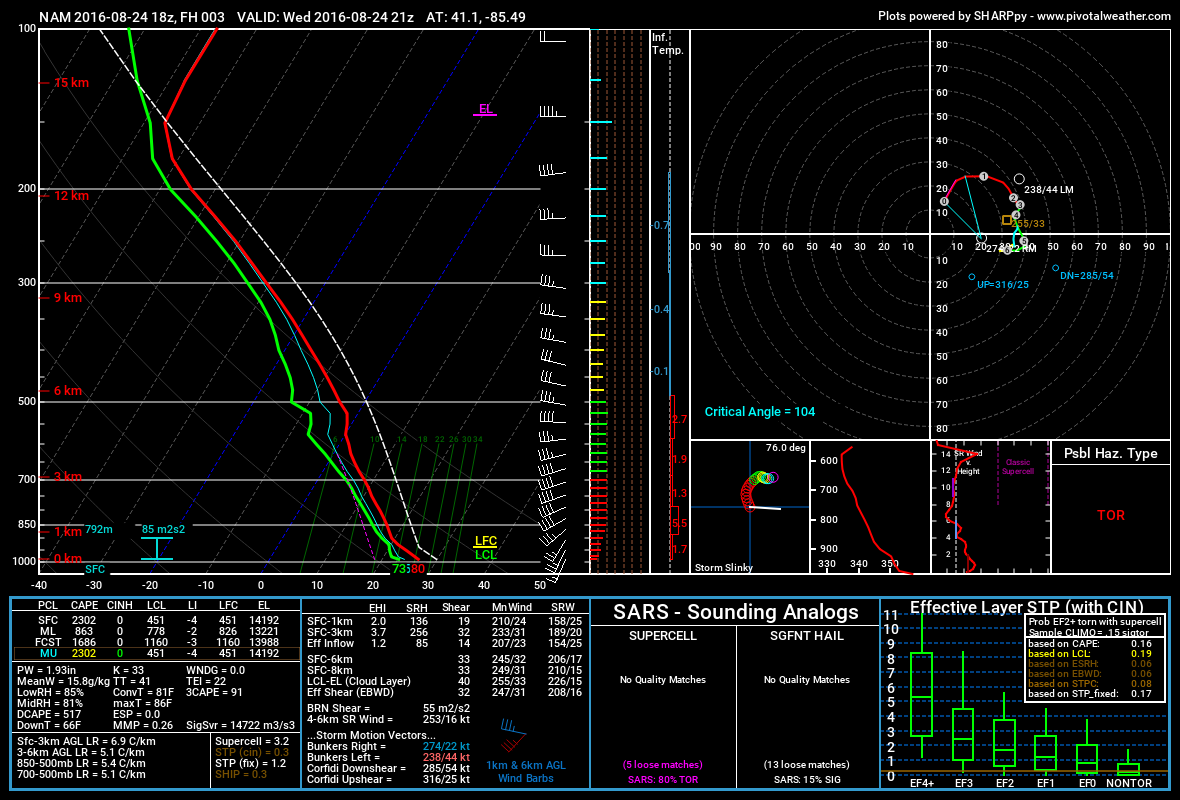
model sounding near tornadoes(1)
model sounding near tornadoes(2)
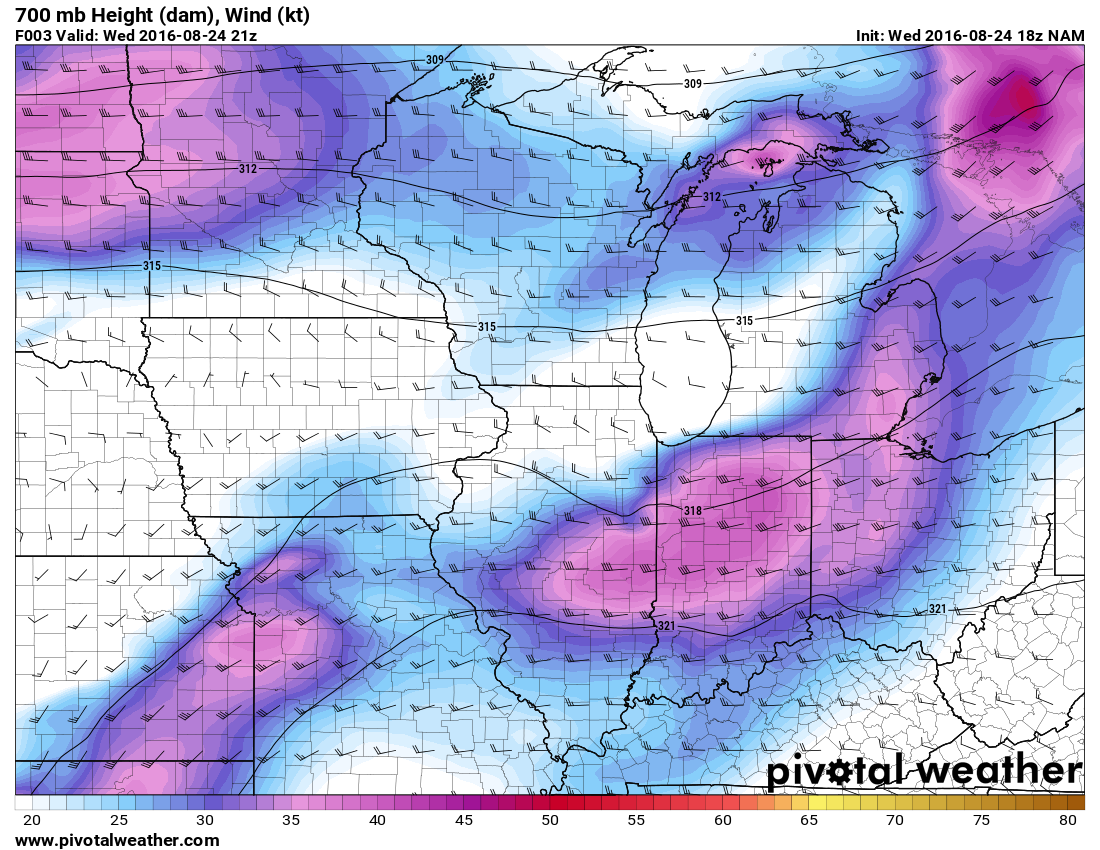
700mb winds
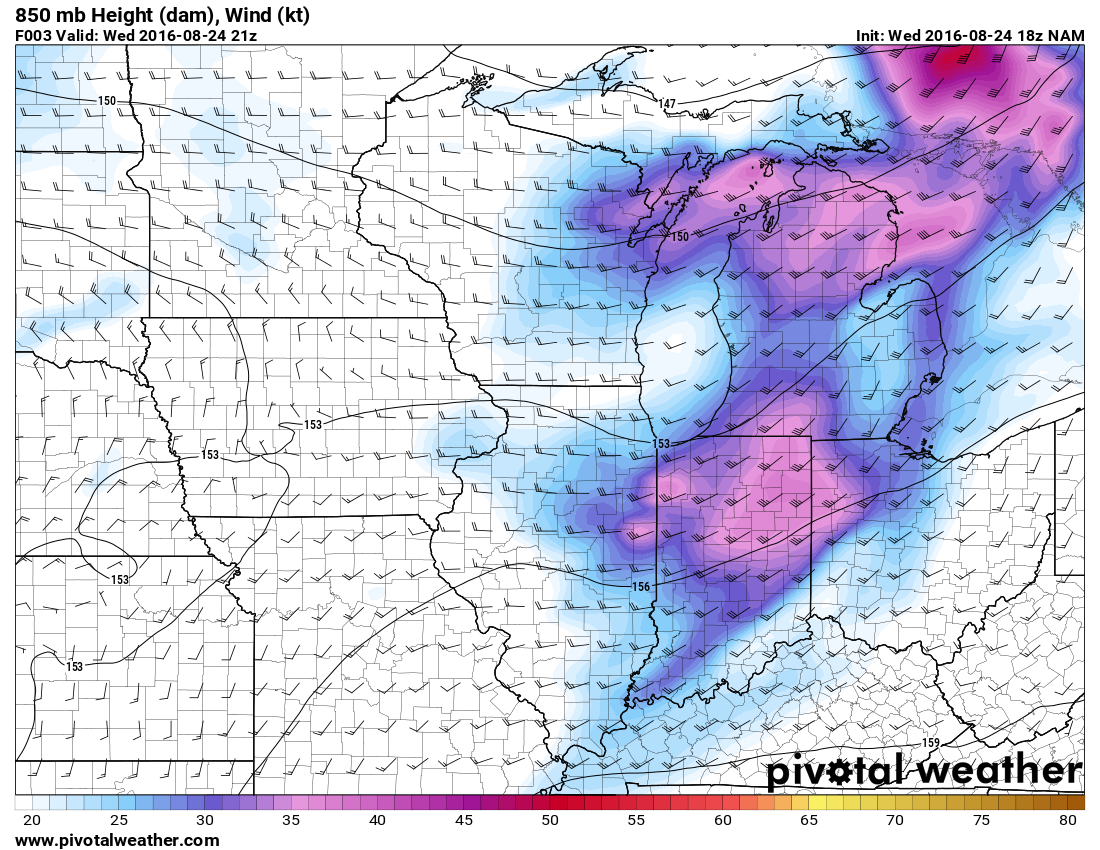
850mb winds
500mb winds
500mb plot
Radar 5:30pm
Radar from 6:20pm
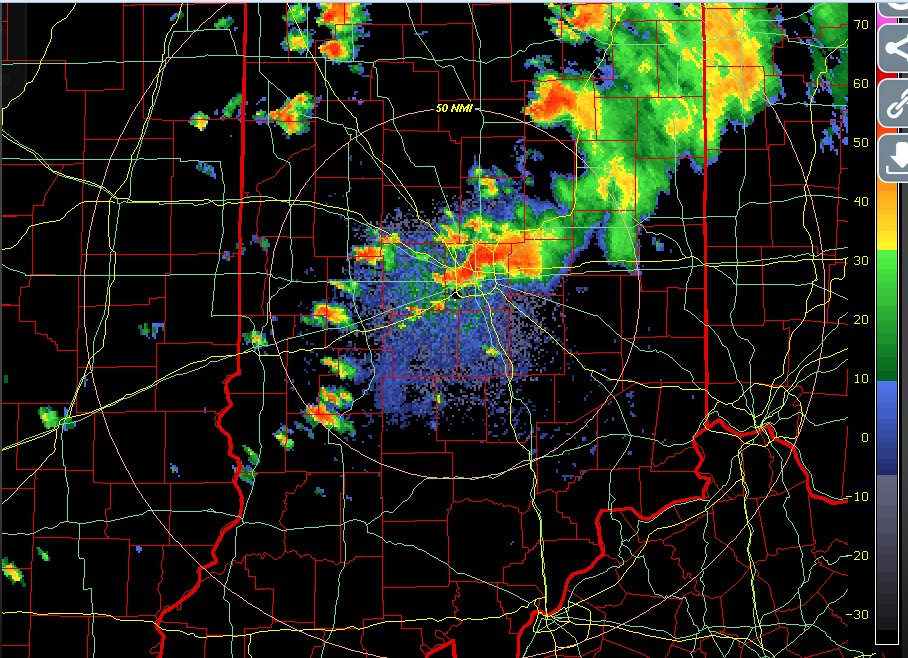
Indianapolis radar (2013z)
Radar (2238z)
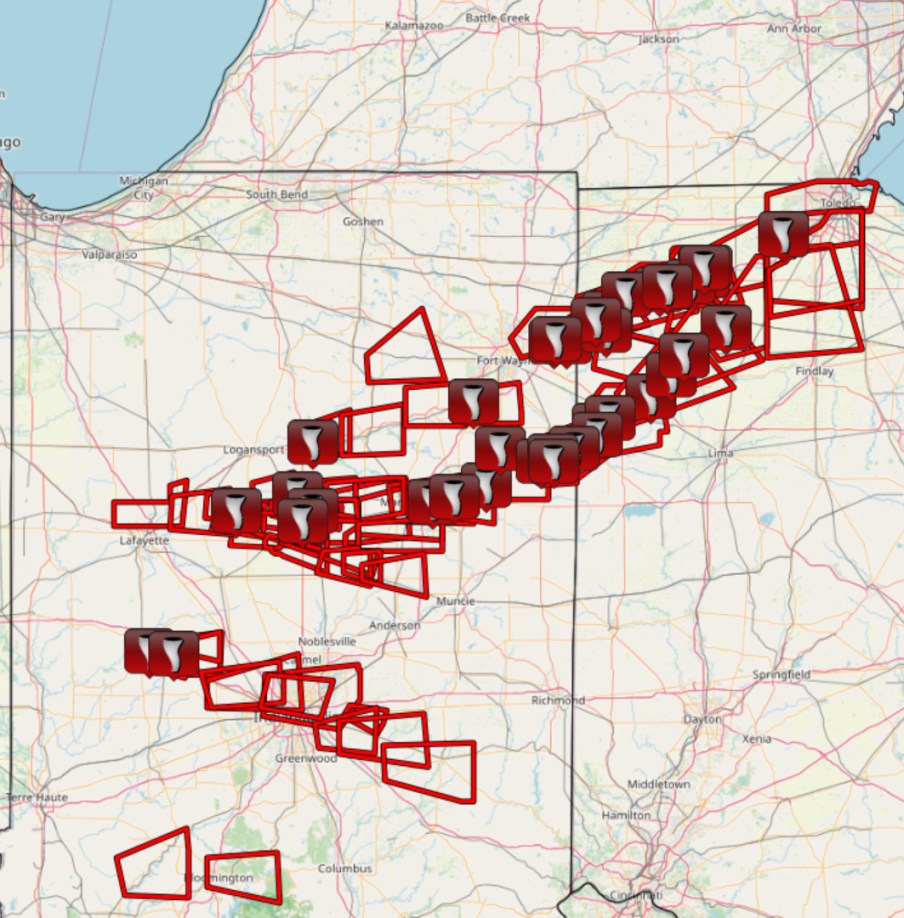
radar-based rotation tracks
Storm reports and warnings
June 15, 2023
A surprise tornado oubreak occured in Ohio and Michigan. The main forecasting focus of this day was the tornadoes in the Southern Plains. In
a separate weather system, an upper level trough was over the Great Lakes, and instability and shear were strong
in a small warm sector in Ohio. A tornado happened at Woodland Beach, Michigan, near Lake Erie. One EF-2 tornado happened in
northeast Toledo (Point Place,) one was in Oregon, one EF-2 was at Oak Harbor. Multiple tornadoes happened in northwest Ohio.
Storm Reports
SPC Outlook Verification
Significant Tornado Parameter(22z)
Significant Tornado Parameter (00z)
0-6km shear
Radar, 6:25pm
radar-based rotation track
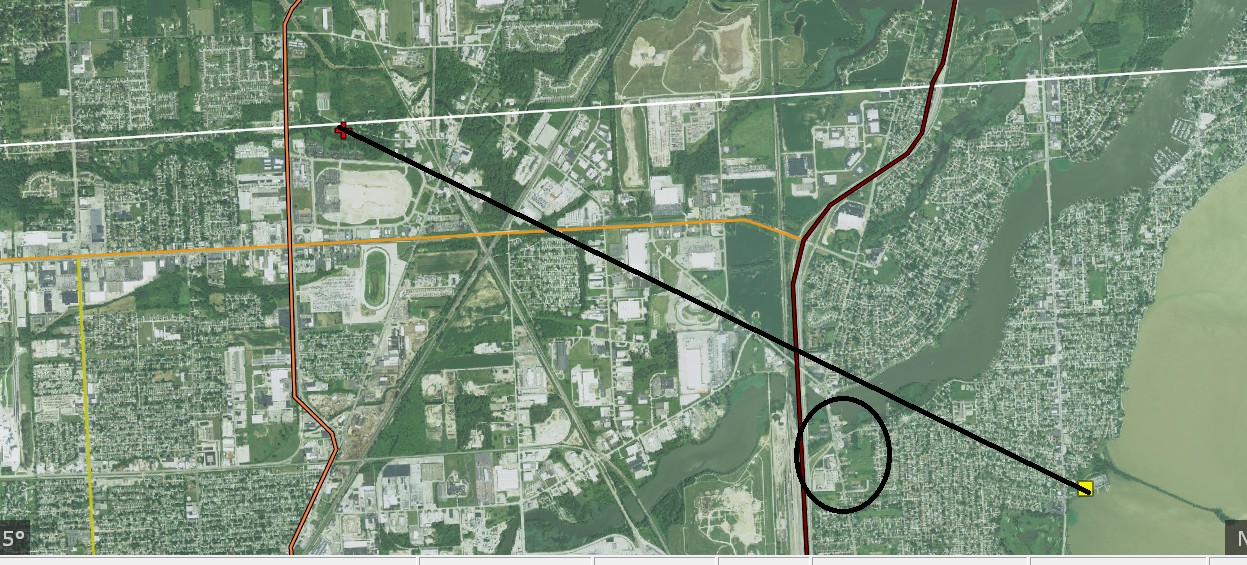
my approximation of damage track
tornado reports and warnings
500mb map
Surface map
tornado damage survey-Toledo
tornado damage survey-Oregon
tornado damage survey-Oak Harbor
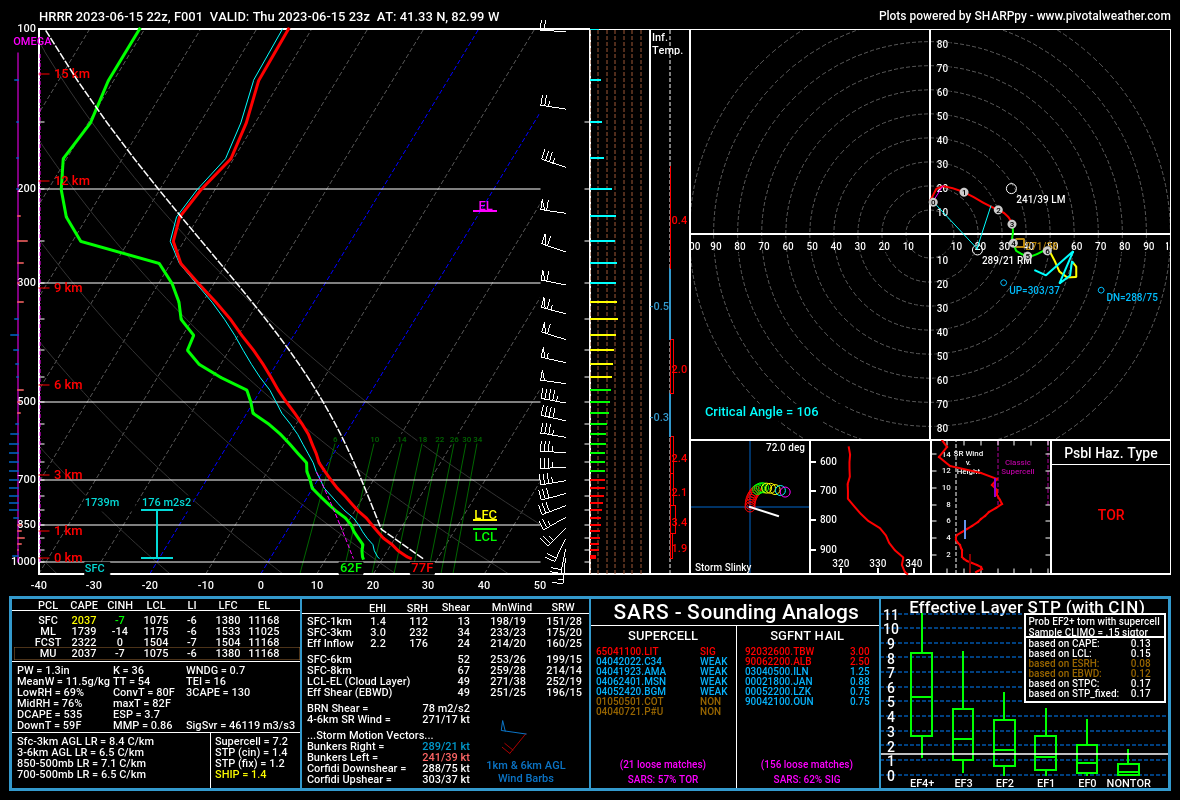
Model sounding
Radar from 7:54pm, large tornado
Picture of tornado in Toledo
SPC Mesoscale discussion (1)
SPC Mesoscale discussion (2)
The purpose is to provide high quality information on historical storms
and provide links to weather information. The "Toledo Snowstorms" web page includes my own research of many snowstorms.